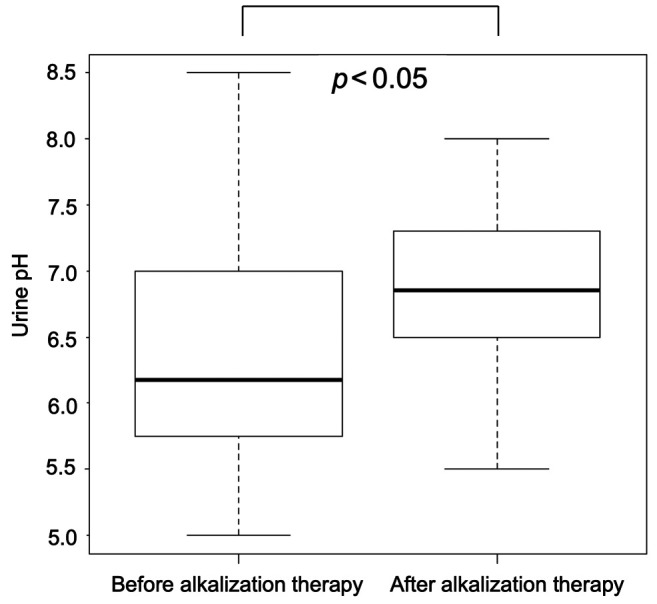
Figure 2. Effect of alkalization therapy on urine pH in the alkalization group. The mean urine pH before (n=36) and after initiation of alkalization therapy (n=36) is shown. The thick lines indicate the medians, the error bars indicate the maximum and minimum values, and the boxes indicate the values between the upper quartile and lower quartile.