. 2020 Sep 3;34(5):2353–2361. doi: 10.21873/invivo.12048

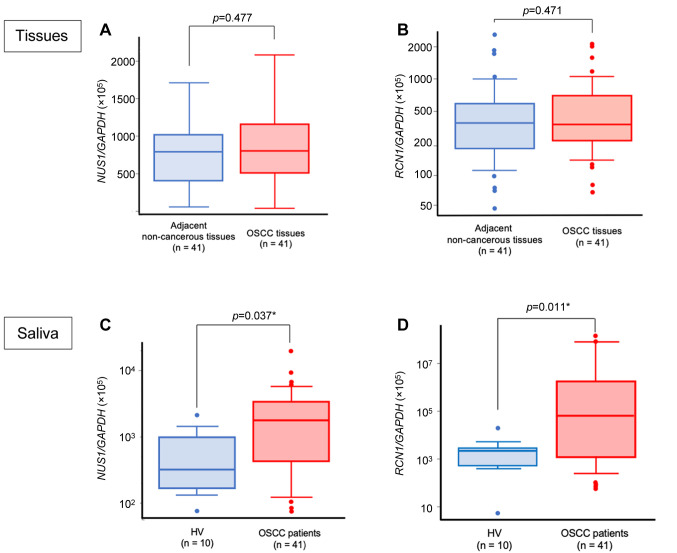
Figure 2. NUS1 and RCN1 expression levels in tissues and saliva. A) Quantitative comparison between OSCC tissues and the adjacent non-cancerous tissues showed no statistically significant difference in NUS1 expression levels (p=0.477). B) Quantitative comparison between OSCC tissues and the adjacent non-cancerous tissues showed no statistically significant difference in RCN1 expression levels (p=0.471). C) OSCC patients had significantly higher expression levels of NUS1 in saliva samples than did the HV group (p=0.037). D) OSCC patients had significantly higher expression levels of RCN1 in saliva samples than did the HV group (p=0.011). HV: Healthy volunteers, OSCC: patients with oral squamous cell carcinoma.

Figure 2