. 2020 Sep 3;34(5):2353–2361. doi: 10.21873/invivo.12048

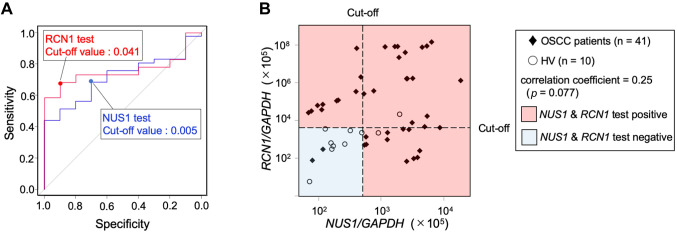
Figure 3. OSCC screening test by salivary NUS1 and RCN1. A) ROC curves for salivary NUS1 and RCN1 expression levels. Data are derived from NUS1 and RCN1 expression levels of OSCC patients and HV. B) OSCC screening test based on a combination of NUS1 and RCN1 expression levels. The cut-off expression level values for OSCC screening were 0.005 and 0.041 for NUS1 and RCN1, respectively. In the OSCC combination screening test, the red area is positive and the blue area is negative. NUS1 and RCN1 were not significantly correlated (Spearman’s rank correlation coefficients=0.25, p=0.077). HV: Healthy volunteers, OSCC: patients with oral squamous cell carcinoma.

Figure 3