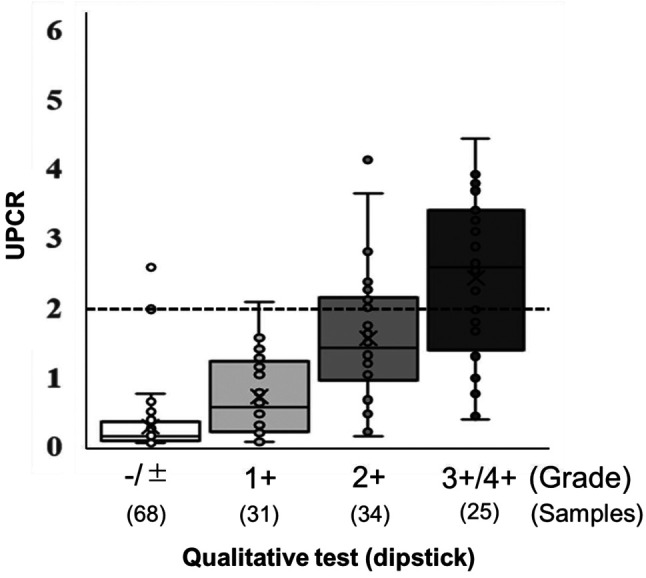
Figure 2. Association between the urinary qualitative test using a dipstick and protein/creatinine ratio (UPCR). The data are expressed as means±standard deviation. The median values are indicated by horizontal lines, and the lower and upper edges of the boxes indicate the 25th and 75th percentiles, respectively.

