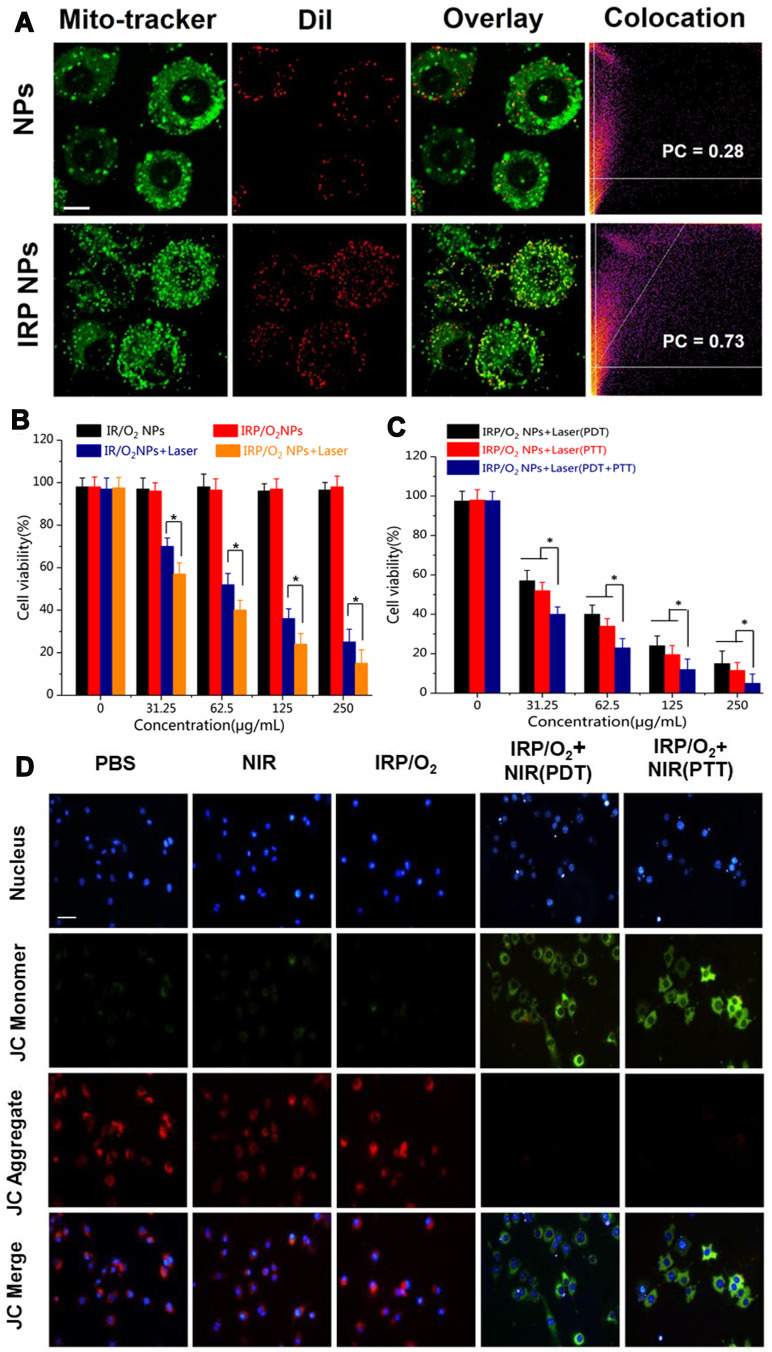
Figure 5.
(A) Mitochondrial tracker colocalized with NPs, IRP NPs and IRP@RBC NPs observed by CLSM, scale bar = 10 μm. (B) The measurement of cytotoxicity of IRP/O2 NPs and IR/O2 NPs toward 4T1 cancer cells with 808 nm laser illumination (PDT) (*p<0.05).(C) The measurement of cytotoxicity of IRP/O2 NPs toward 4T1 cancer cells with 808 nm laser illumination (PDT, PTT, PDT+PTT) (*p<0.05). (D) The mitochondrial potential changes of 4T1 cells after different treatments imaged by JC-1 staining, scale bar = 50 μm.

