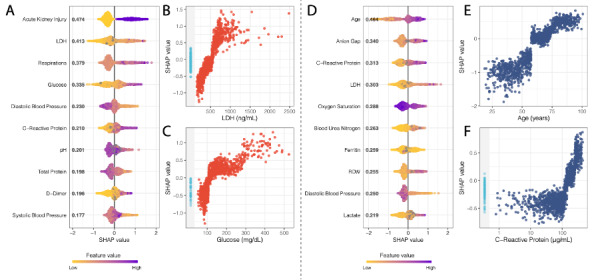
Figure 4.

SHAP summary plots for critical event (A) and mortality (D) at 7 days showing the SHAP values for the 10 most important features for the respective XGBoost models. Features in the summary plots (y-axis) are organized by their mean absolute SHAP values (x-axis), which represent the importance of the features in driving the prediction of the classifiers for patients. (B) and (C) Dependency plots demonstrating how different values can affect the SHAP score and ultimately impact classifier decisions for LDH and glucose, respectively, for critical event prediction. (E) and (F) Dependency plots for age and C-reactive protein levels. Patients with missing values for a feature in the dependency plot are clustered in the shaded area to the left. LDH: lactate dehydrogenase; RDW: red cell distribution width; SHAP: SHapley Additive exPlanation.
