
Figure 5.
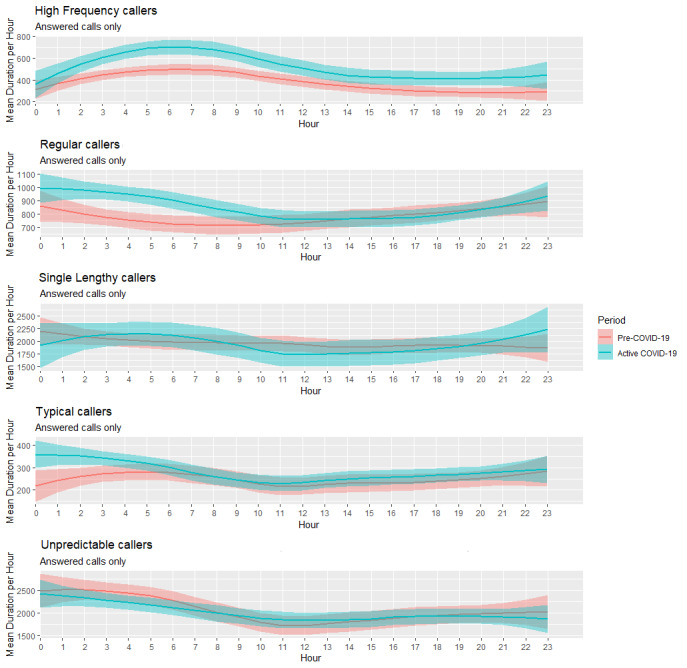
Smoothed conditional means plots displaying the mean call durations in seconds for the five caller types across a 24-hour period between the Pre-COVID-19 and Active COVID-19 periods.
Official websites use .gov
A
.gov website belongs to an official
government organization in the United States.
Secure .gov websites use HTTPS
A lock (
) or https:// means you've safely
connected to the .gov website. Share sensitive
information only on official, secure websites.
Smoothed conditional means plots displaying the mean call durations in seconds for the five caller types across a 24-hour period between the Pre-COVID-19 and Active COVID-19 periods.