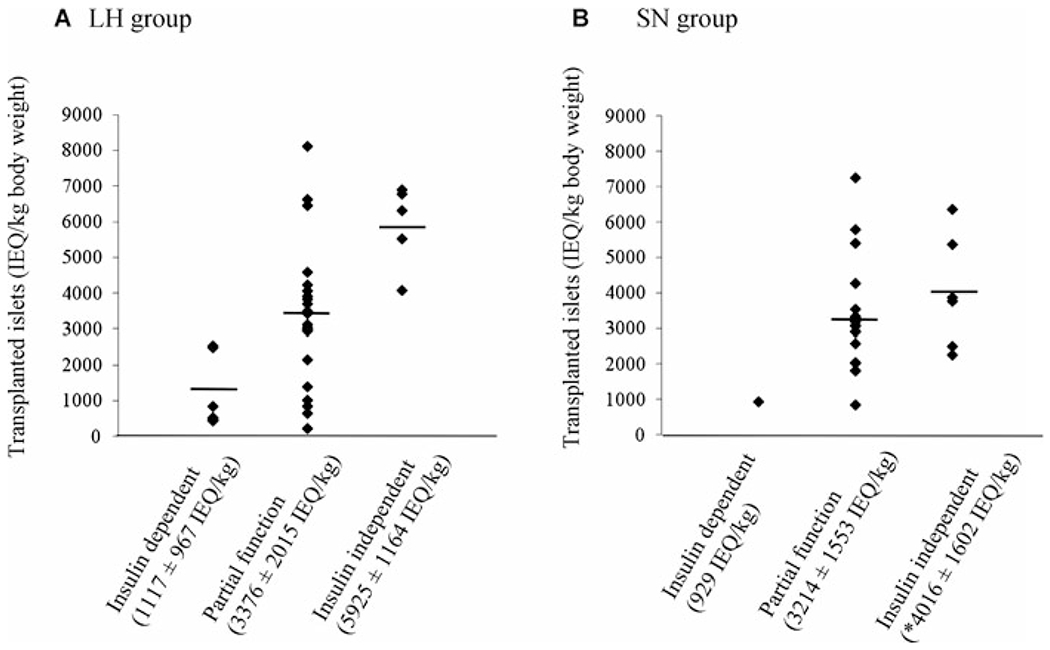
Figure 3: Short-term metabolic outcome according to islet yield in the LH (n = 33) and SN groups (n = 26).

The mean islet yield (expressed as IEQ/kg ± SD) was highest in full graft function and lowest in graft failure in both groups, but there was a considerable overlap. *p < 0.05 versus insulin independent in the LH group; LH = Liberase-HI; SN = SERVA/Nordmark; IEQ = islet equivalent.
