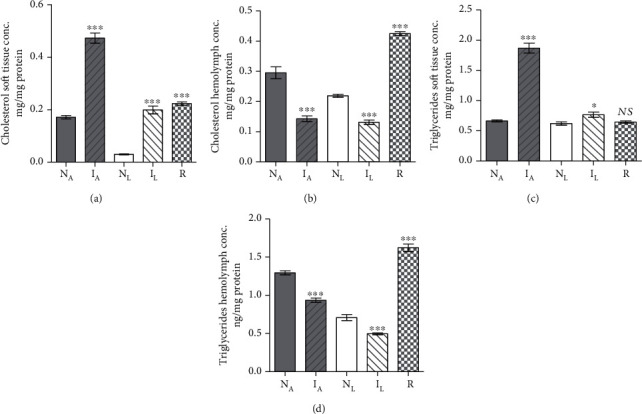
Figure 4.

Each column represents mean soft tissue cholesterol (a), hemolymph cholesterol (b), soft tissue triglycerides (c), and hemolymph triglyceride (d) content for five B. truncatus snails, and vertical bars the SE about the mean. NA: naïve-algae fed; IA: infected-algae fed; NL: naïve-lettuce fed; IL: infected-lettuce fed; R: resistant snails. Statistical differences between naïve and infected or resistant same diet-fed snails are shown; ∗∗∗P < 0.001, ∗P < 0.05. NS: not significant.
