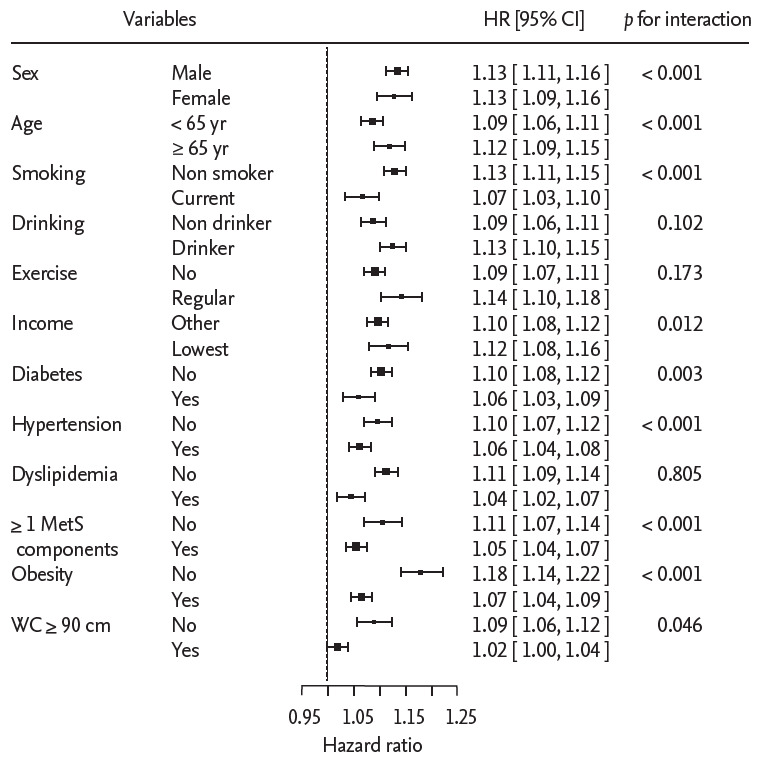
Figure 3.

Forest plot of hazard ratios by subgroups according to variables. Multivariate logistic regression analysis was used after controlling for age, smoking status, alcohol consumption, regular exercise, and yearly income. HR, hazard ratio; CI, confidence interval; MetS, metabolic syndrome; WC, waist circumference.
