FIGURE 1.
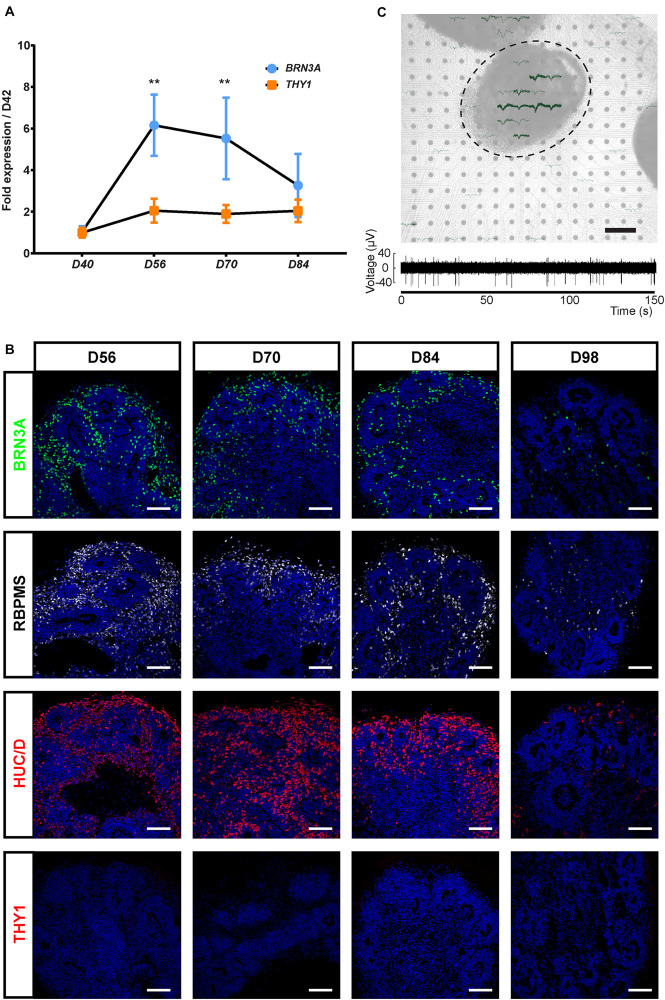
Characterization of the retinal ganglion cell (RGC) population in human induced pluripotent stem cell (hiPSC)-derived retinal organoids. (A) RT-qPCR analysis of BRN3A and THY1 during differentiation between D42 and D84 (mean ± SEM; N = 3 differentiations per time point; n ≥ 10 organoids/differentiation). Gene expression at each time point is indicated relative to organoids at D42. **p < 0.01, Kruskal–Wallis test followed by Dunn’s multiple comparison. (B) Immunostaining showing the expression of BRN3A, RBPMS, HuC/D, and the absence of THY1 immunoreactivity in sections of retinal organoids, from D56 to D98. Nuclei were counterstained with DAPI (blue). Scale bars, 100 μm. (C) Top, infrared image displaying an organoid cultured on a 256-recording site (gray dots) MEA chipset. Electrical activity showed as superimposed waveforms is observed at the level of the organoid (N = 7 independent experiments including 10 electrodes showing electrical activity). Scale bar, 200 μm. Bottom, raw data trace example of a recorded neuron from the same organoid exhibiting spontaneous firing activity.

