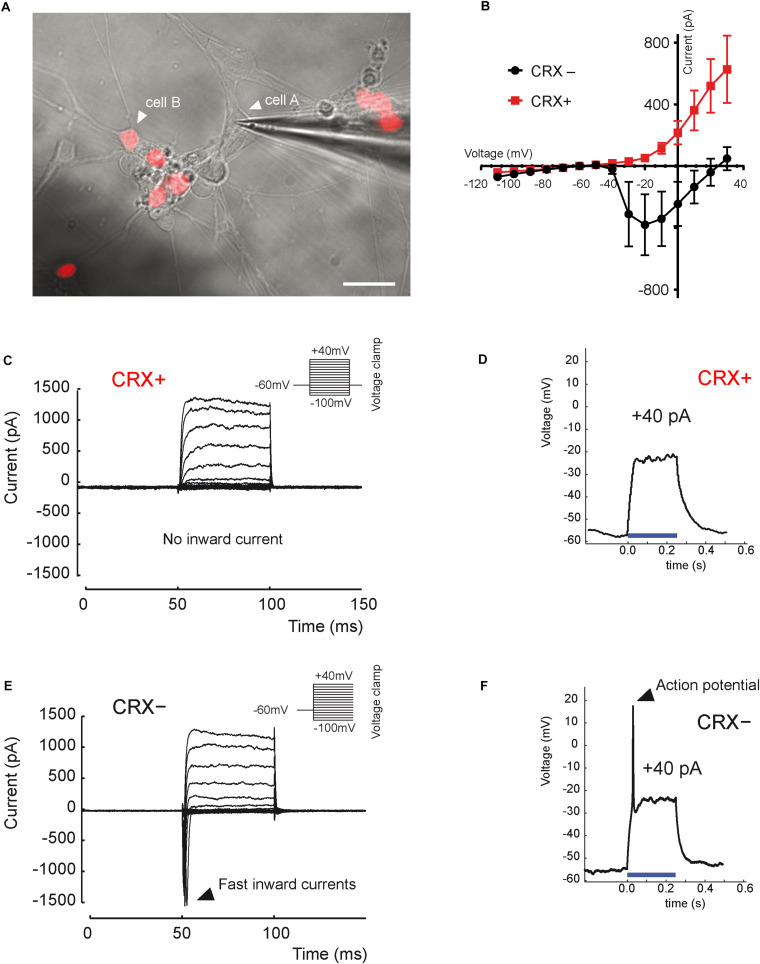
FIGURE 4.
Distinct electrical properties of hiPSC-derived RGCs and hiPSC-derived CRX-positive photoreceptors. (A) Infrared image of a monolayer of retinal cells derived from D56 organoid generated from the adeno-associated virus integration site 1 (AAVS1):CrxP_H2BmCherry hiPSC line, 3 weeks after plating. Epifluorescence images revealing mCherry+ cells corresponding to CRX+ photoreceptors are superimposed (white arrow head on cell A; a recording electrode is in contact with a mCherry– (CRX–) non-photoreceptor cell showing an RGC morphology (white arrow head on cell A). Scale bar: 25 μm. (B) Mean current–voltage (I–V) relationship curve of CRX– (black curve) and CRX+ (red curve) cells, calculated as the minimum current value observed during the first 10 ms of each voltage step. Fast inward currents peaking around –20 mV are only visible for CRX– cells (mean ± SEM; N = 3; n = 7). (C,E) Current responses to voltage steps of CRX+ (C) and CRX– (E) representative cells by stepping the membrane potential from –100 to +40 mV in 10-mV increments (N = 3; n = 11). Only CRX– cells displayed fast inward currents. (D,F) Voltage responses of CRX+ (D) and CRX– (F) representative retinal cells to a +40-pA current injection (blue line). Evoked action potentials were observed only in CRX– cells (N = 3; n = 4).

