FIGURE 5.
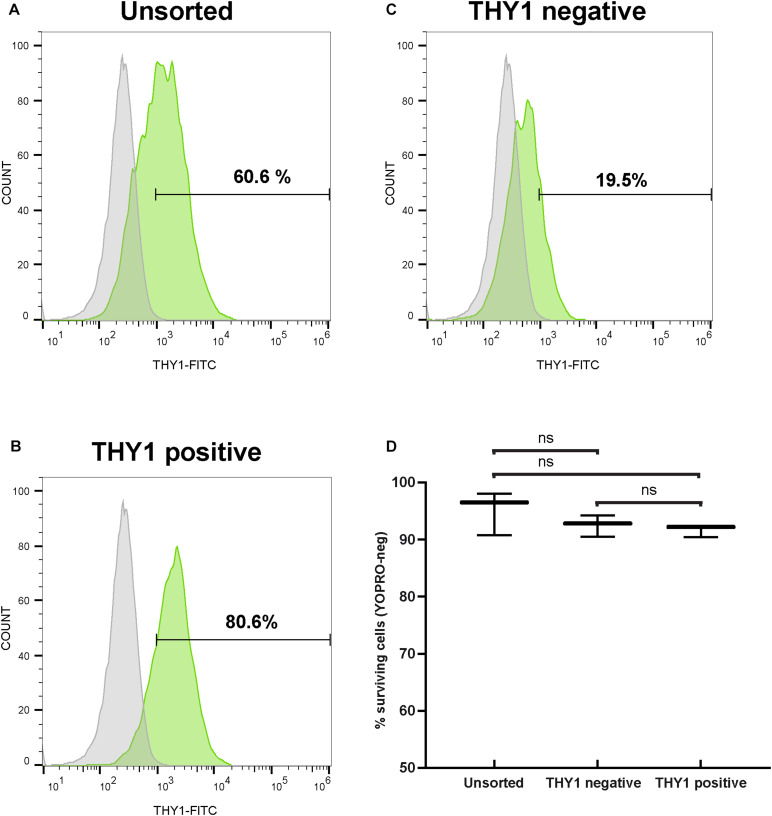
Selection of hiPSC-derived RGCs by targeting THY1. (A–C) One representative THY1 flow cytometry analysis plot of the different fractions before (A) and after magnetic-activated cell sorting (MACS) (B: THY1-positive fraction; (C): THY1-negative fraction). Fluorescence intensity indicative of FITC-conjugated THY1 primary antibody binding is shown on the x-axis. Specific staining in green; Non-specific binding was estimated by incubation with a mouse IgG1 FITC-conjugated isotypic antibody (in gray). (D) Quantitative analysis by flow cytometry of living cells (YOPRO-negative) on unsorted, THY1-negative, and THY1-positive fractions from retinal organoid-derived dissociated cells, 1 week after plating (min to max; N = 3 differentiations; n = 308 organoids; ns: not statistically significant two-way ANOVA followed by Tukey’s multiple comparison test).

