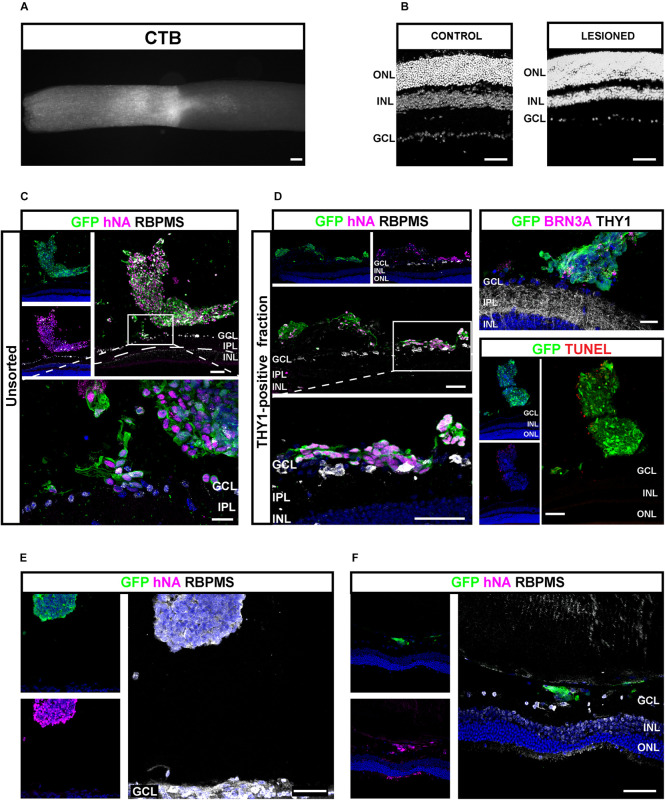
FIGURE 9.
Injection of hiPSC-derived RGCs in the vitreous of optic nerve crush mice model. (A) Alexa 555-conjugated CTB-β-labeled optic nerve crush revealing the lesion site. Scale bar: 100 μm. (B) DAPI staining showing the RGC loss in the GCL 5 weeks after optic nerve crush. Scale bar: 100 μm. (C–F) Immunostaining in retinal sections from mice grafted with unsorted (C) or MAC-sorted THY1-positive fractions (D) 1 week after transplantations, and MAC-sorted THY1-positive cells (E,F) 4 weeks after transplantations. The delimitated areas indicate the location of high-magnification image below. Transplanted cells are identified according to GFP and human marker hNA immunoreactivity (C–F). RGCs are identified according to BRN3A (D) or RBPMS expression (C–F). Notice the close apposition of transplanted cells to GCL (D). Evaluation of cell death among engrafted cells was performed according to TUNEL labeling (D). Notice the small number of TUNEL-positive cells. Scale bars: 100 μm (A–D) or 50 μm (E,F). GCL, ganglion cell layer; INL, inner nuclear layer; IPL, inner plexiform layer; ONL, outer nuclear layer.

