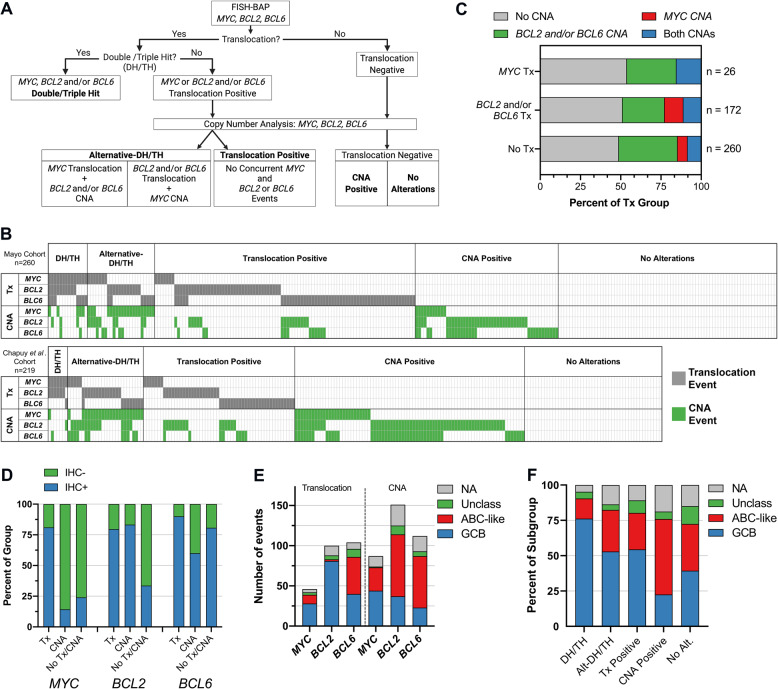
Fig. 1. Identification and prevalence of MYC, BCL2, and BCL6 translocations and copy number gains.
A Analysis workflow for identification of MYC, BCL2, and BCL6 translocation and/or can subgroups. B The landscape of translocations and CNAs (only copy number gains are shown), among DH/TH, Alt-DH/TH, translocation positive, copy gain positive, and no alteration subgroups in the Mayo Cohort (upper panel, n = 260) and the Chapuy et al. Cohort (lower panel, n = 219). C Frequencies of CNA combinations in translocation subgroups, excluding DH/TH. D Percentage of patients positive and negative for protein expression (MYC n = 192, positive ≥ 40% cells; BCL2 n = 201, positive ≥ 50% cells; BCL6 n = 41, positive ≥ 30% cells) according to their translocation (Tx) and CNA status. E Total number of Translocation or CNA events for each alteration by COO. F Percentage of each COO subgroup according to their genetic subgroup.

