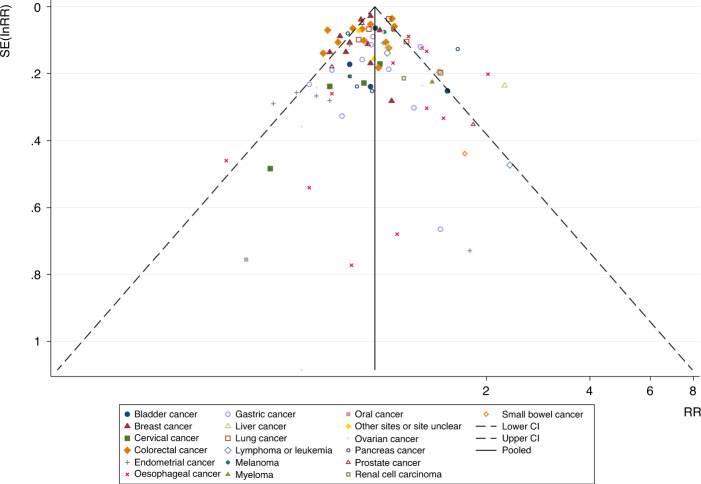
Fig. 3. Funnel plot of the meta-analysis of the association between bisphosphonates and risk of all cancers.
The abscissa is the effect size (RR), and the ordinate is the standard error of the effect size (SE (InRR)). Small symbols of different shapes represent the studies involved in different cancers. The vertical line in the middle represents the combined RR value, and the two oblique dashed lines represent the 95% confidence intervals of the funnel graph. The funnel plot of the association between the use of bisphosphonates and the risk of overall cancers as well as each type of cancer did not indicate substantial asymmetry.

