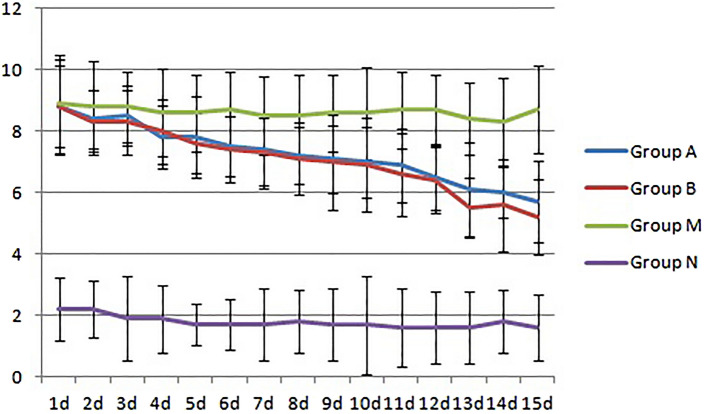
Figure 10.
Symptom scores for the four groups. Group M was the model control group, for which the score was significantly higher than that of the healthy control group N (p < 0.05). Groups A and B were the model treatment groups. With the extension of the treatment time, the symptom score gradually decreased. Compared with the score of group M, there was a significant decrease in the score starting on the 4th day (p < 0.05), but the difference between the two groups was not obvious (p > 0.05).

