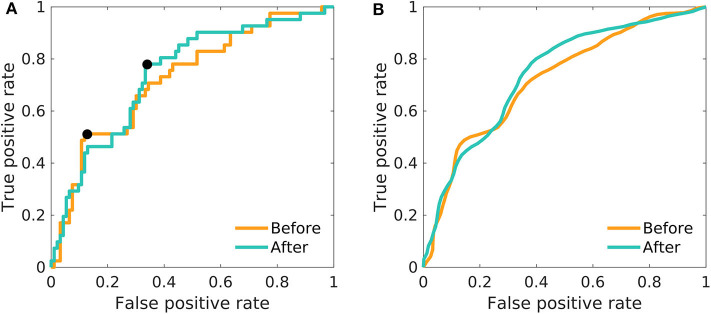
Figure 2.
The ROC curves of one-dimensional logistic regression. Differences between men and women in the mean relative beta power; before as well as after the treatment. (A) The model was fitted on the whole dataset using the mean relative beta power. The black pointers indicate the position on the ROC curve, for which the overall accuracy is reported in Table 1. (B) The model was fitted 100-times on a random balanced subsample of 80 patients, and the resulting ROC-curves were averaged.

