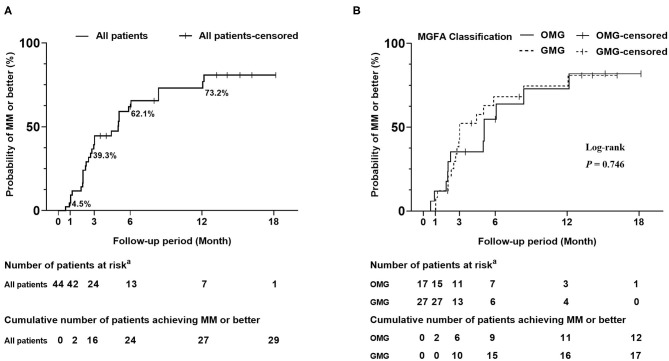
Figure 3.
Kaplan-Meier curves for the cumulative probability of achieving “MM or better”. (A) Cumulative probability of achieving “MM or better” in all patients. The cumulative probability of achieving “MM or better” was 4.5, 39.3, and 62.1% at 1 month, 3 months, and 6 months, respectively. Finally, it rose to 73.2% at 12 months. (B) Cumulative probability of achieving “MM or better” in subgroups of OMG and GMG. A log-rank test was used for the comparison of treatment outcome between subgroups of OMG and GMG. Crossing marks indicated censoring time; “MM or better” included MGFA post-intervention status of minimal manifestations, pharmacological remission and complete stable remission. aNumber of patients who were still in the study and did not achieve “MM or better” at the end of specified time. OMG, ocular myasthenia gravis; GMG, generalized myasthenia gravis.

