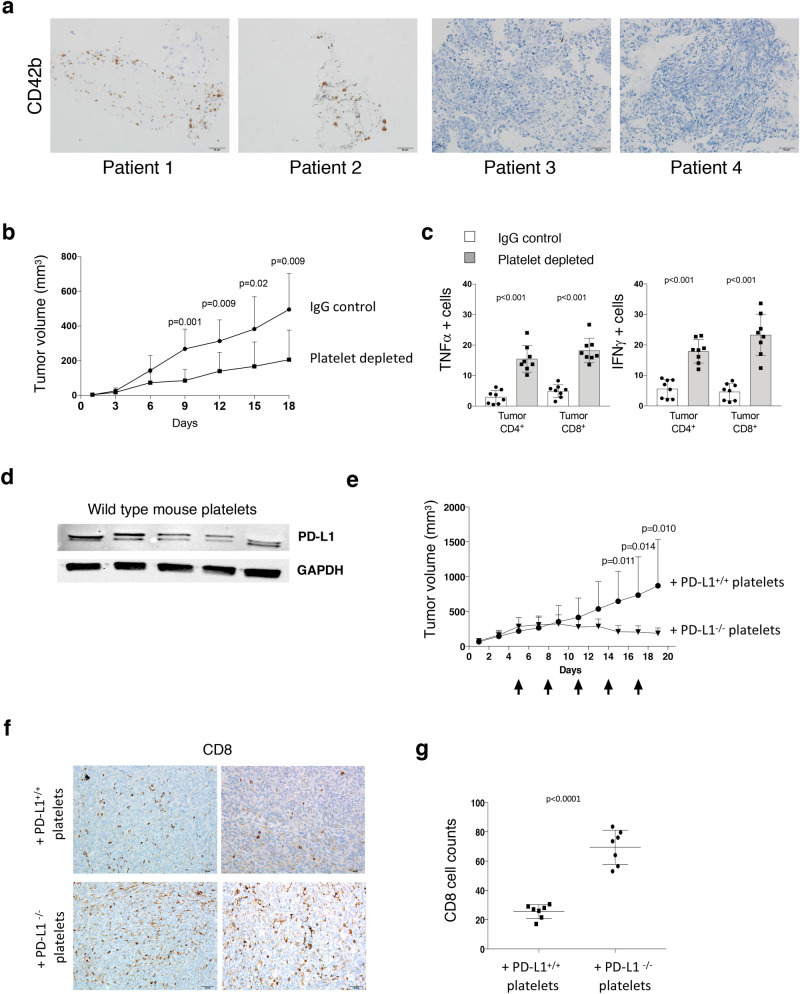
Figure 1.
Platelet PD-L1 modulates PD-L1 negative tumor growth and T cell cytotoxicity. (a) Immunohistochemical analysis for platelets (CD42b) in human PD-L1 negative (metastatic lymph node) tumor tissues from two patients who did (#1 and #2) and (primary lung tissues) from patients who did not (#3 and #4) display a positive response to atezolizumab (anti-PD-L1 agent). Biopsy was taken before checkpoint inhibitor therapy was started. CD42b expression (brown). Scale Bar = 50 μm. (b) Wild type mice were inoculated with MC38 PD-L1 KO tumor cells and platelet depleted with antiplatelet GPIBα antibody or isotype control (IgG1). Tumor growth was measured by calipers at the indicated days. (c) Summary bar chart graphs show flow data from intracellular staining of MC38 PD-L1 KO tumor tissues. T cell (CD4+ and CD8+) effector cytokines (TNFα and IFNγ) were measured. Data are expressed as a percentage (n = 7 per group). (d) Western blot of PD-L1 expression in wild type mouse platelets. Each lane in the blot represents PD-L1 protein expression in platelets from a single mouse. GAPDH is used as the loading control. e. PD-L1−/− mice were inoculated with MC38 PD-L1 KO tumor cells. Mice were platelet depleted with antiplatelet GPIBα antibody before transfusion of platelets from wild type (PD-L1 positive) or PD-L1−/− (PD-L1 negative) mice. Tumor growth was measured by calipers at the indicated days. Black arrows designate time points of platelet depletion and platelet transfusions. (f) Representative images of immunohistochemical staining of MC38 PD-L1 KO tumors from mice transfused with platelets from WT (PD-L1+/+) mice and PD-L1 KO (PD-L1−/−) mice with antibodies to CD8+ cell (brown) and Ki67 (brown) at 20X. Scale bar = 50 μm. (g) Summarizing bar graph showing the number of tumor infiltrated CD8+ cells per field for each MC38 PD-L1 KO tumor from mice transfused with platelets from either PD-L1+/+ (n = 8) or PD-L1−/− mice (n = 8). Actual p values are shown unless non-significant (ns.). Students T-test (unpaired, two-tailed). Error bars represent the mean ± standard deviation.

