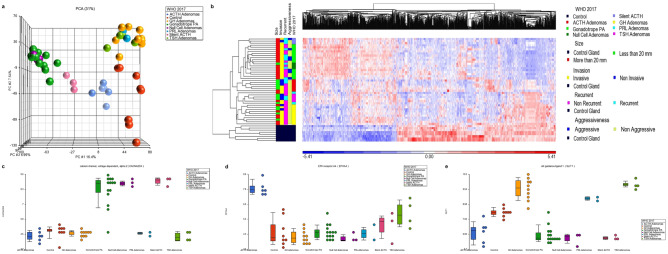
Figure 1.
(A) PCA of pituitary adenoma (PA) transcriptome showing three distinct clusters: POU1F1-driven GH-, TSH- and PRL-adenomas; NR5A1-driven gonadotropinomas and null cell adenomas; and TBX19-driven clinically evident ACTH adenomas. Silent ACTH PA grouped separately sharing features with both, TBX19-dependent and NR5A1-dependent adenomas. (B) Heatmap of the differentially expressed genes. In the “Y” axis tumor samples are grouped according to the World Health Organization (WHO) 2017 classification as gonadotrope cell adenomas, null-cell adenomas, clinically evident ACTH adenomas, clinically silent ACTH adenomas, somatotrope adenomas, prolactinomas and TSH adenomas; tumors are also classified in the figure according to clinical features such as size, invasion, recurrence and aggressiveness. The “X” axis represents the differentially expressed genes hierarchical cluster. (C) CACNA2D4 is upregulated in NR5A1-driven tumors; (D) EPHA4 is upregulated in TBX19-driven tumors; (E) SLIT1 is upregulated in POU1F1-driven tumors. Image was created using Partek Genomics Suite 7.19v (https://www.partek.com/partek-genomics-suite/).

