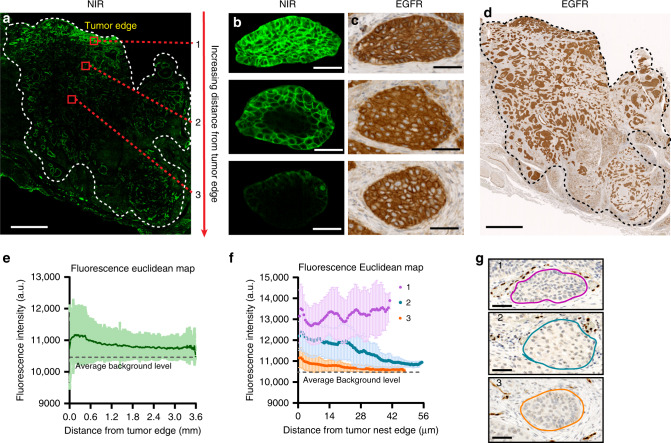
Fig. 3. Antibody–dye distribution demonstrated both macroscopic and microscopic heterogeneity within the solid tumor.
a Antibody–dye uptake (NIR: near-infrared) was higher in the tumor periphery or edge (especially the epithelium) than that in the tumor interior (Scale bar: 2 mm). b, c Antibody penetrated deeper into tumor nests located close to the edge of the bulk tumor than tumor nests located further away from the tumor edge, which was not attributable to EGFR (epidermal growth factor receptor) expression (Scale bar: 50 μm). d EGFR expression level is similar across the entire tumor (Scale bar: 2 mm). e The fluorescence intensity negatively correlated with increasing distance from the edge of the bulk tumor. f The fluorescence intensity plot depicted varying degree of antibody penetration into tumor nests: 1. fully saturated tumor nests at the periphery; 2. partially saturated tumor nests; 3. poorly penetrated tumor nests at the center of the tumor. (The shaded area in e and f means standard deviation). n = 3 tumor nests from the same patient. g Vessel staining (ERG) corresponding to region 1, 2, 3 in f (Scale bar: 50 μm).

