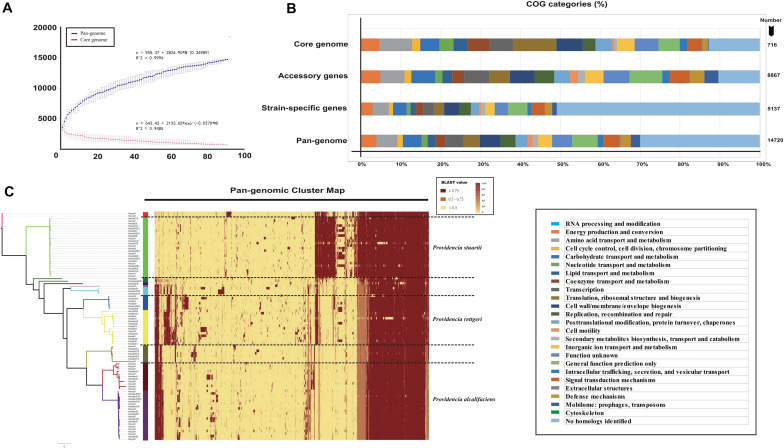
FIGURE 1.
Genetic diversity of genome in Providencia. (A) Core and pan-genome curves showed the downward trend of the core gene families and the upward trend of the pan-gene families with the increase in the number of genomes. The error bars indicated the standard deviation of the number of core and pan-gene families. The fitting mathematical functions of the core and pan-genome curves were shown. (B) Distribution of COG categories for each gene family set. (C) Cluster map of the pan genome of Providencia.

