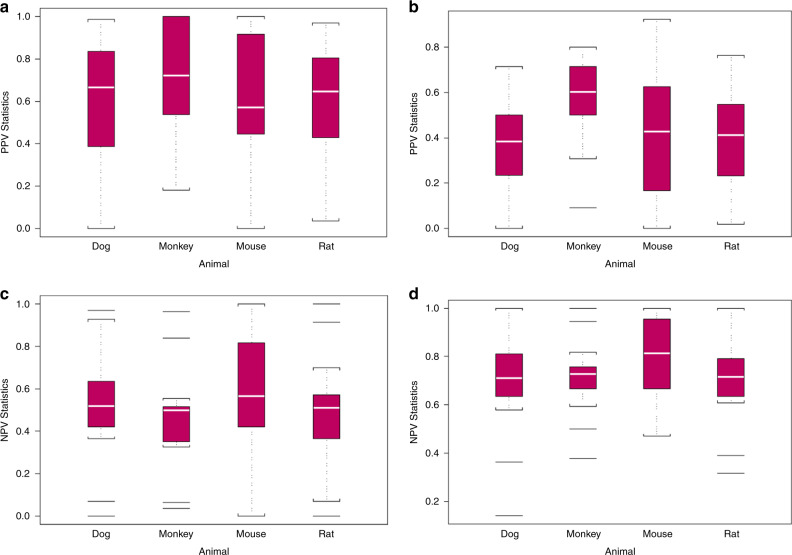
Fig. 2. Box and whisker plots show quartiles of the distribution of positive predictive values (PPVs) and negative predictive values (NPV) of human toxicities based on animal toxicities.
For each animal model, a PPV for all toxicity grades (median: dog = 0.67, monkey = 0.72, mouse = 0.57, rat = 0.65), b PPV for grade 3 and 4 toxicities (median: dog = 0.38, monkey = 0.60, mouse = 0.43, rat = 0.41), c NPV for all toxicity grades (median: dog = 0.52, monkey = 0.50, mouse = 0.57, rat = 0.51), and d NPV for grade 3 and 4 toxicities (median: dog = 0.71, monkey = 0.73, mouse = 0.81, rat = 0.72).

