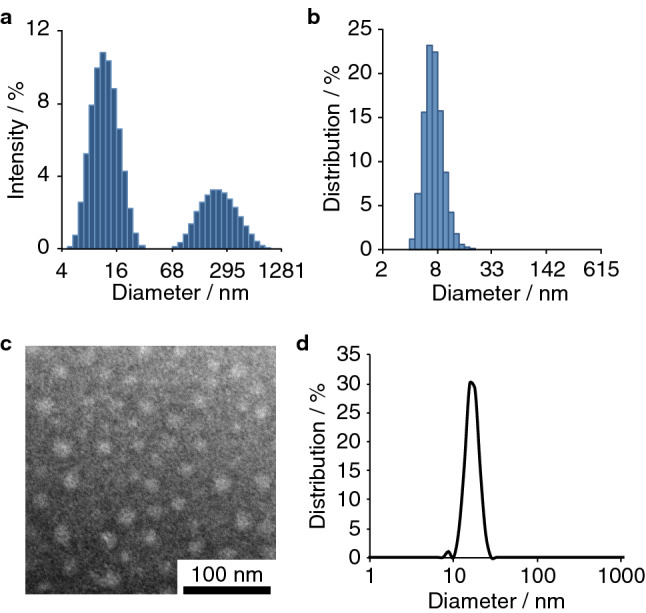
Figure 2.

Intensity-weighted (a) and volume-weighted (b) DLS (Dynamic Light Scattering) size distribution profiles and TEM (Transmission Electron Microscopic) images (c) and size distribution histogram (d) for 800RS-PMPC. DLS samples of 800RS-PMPC (1 mg/mL H2O) were filtered through a 0.8 µm filter just prior to measurements. TEM samples of 800RS-PMPC (2 mg/mL H2O) were negatively stained with phosphotungstic acid (2.8 wt%, pH 7.0).
