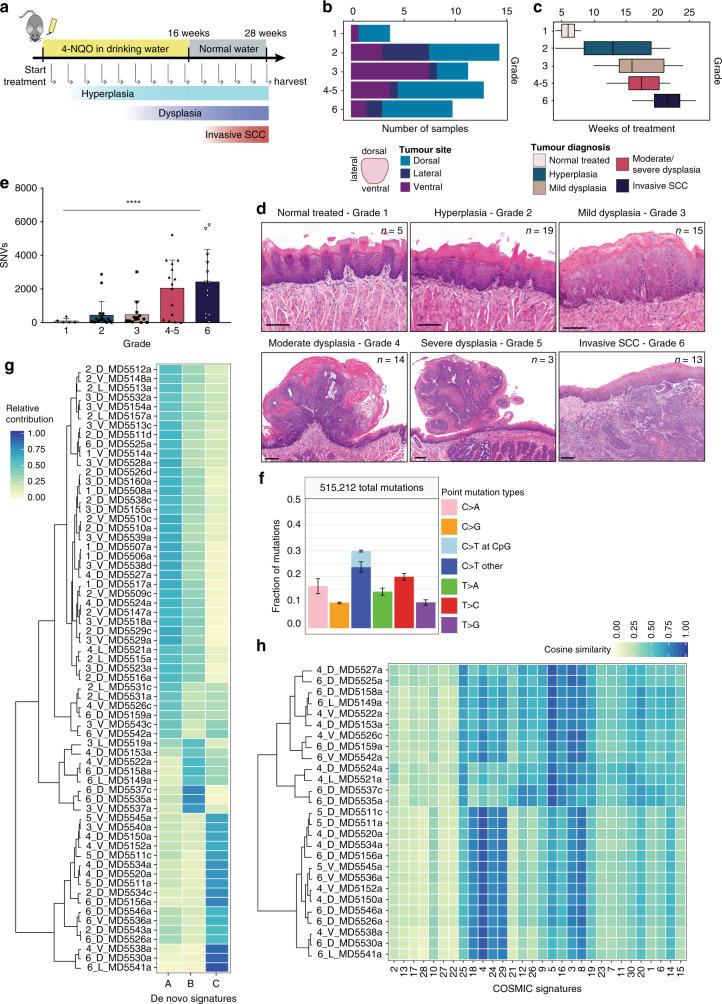
Fig. 1. Mutational burden and signature of 4NQO-induced TSCCs.
a Schematic of 4NQO tumorigenesis protocol. Mouse image obtained from Pixabay (https://pixabay.com/service/terms/) and used in accordance with the terms of the Pixabay License. OSCCs were induced in C57BL/6 mice (n = 75) by administration of 4NQO carcinogen in the drinking water of mice for 16 weeks. Harvesting of tumours was done every 2 weeks for a total of 26 weeks. b Distribution of tumours on the tongue by grade. c Distribution of tumour grade according to the number of weeks of 4NQO treatment represented as boxplots (the middle line is the median, the lower and upper hinges are the first and third quartiles, the upper whisker extends from the hinge to the largest value no further than 1.5× inter-quartile range from the hinge and the lower whisker extends from the hinge to the smallest value at most 1.5× inter-quartile range of the hinge. Data beyond the end of the whiskers are outliers that are plotted individually). d Histological heterogeneity of 4NQO-induced TSCCs. Representative images of haematoxylin & eosin staining (H&E) of tongue lesions for each tumour grade: Grade 1 (normal 4NQO-treated, n = 5), Grade 2 (hyperplasia, n = 19), Grade 3 (mild dysplasia, n = 15), Grade 4 (moderate dysplasia, n = 14), Grade 5 (severe dysplasia, n = 3) and Grade 6 (invasive SCC, n = 13). Scale bars 100 µm. e Differences in mutation burden by grade. Barplot depicts total SNVs per tumour grade (n = 65 biologically independent samples, bar graphs represent mean ± SD, ****p < 0.0001, one-way ANOVA). f Mutational signature of all 4NQO-induced OSCCs (N = 515,212 mutations, n = 65 samples, bar graphs represent mean ± SD over all samples). g De novo signatures. h Similarity heatmap featuring the contribution of known COSMIC signatures calculated using MutationalPatterns (R package) for tumour grades 4, 5 and 6. Each number corresponds to the tumour reference: tumour grade (1–6), tumour site (D, dorsal; L, lateral; V, ventral) and the tumour sequencing ID.

