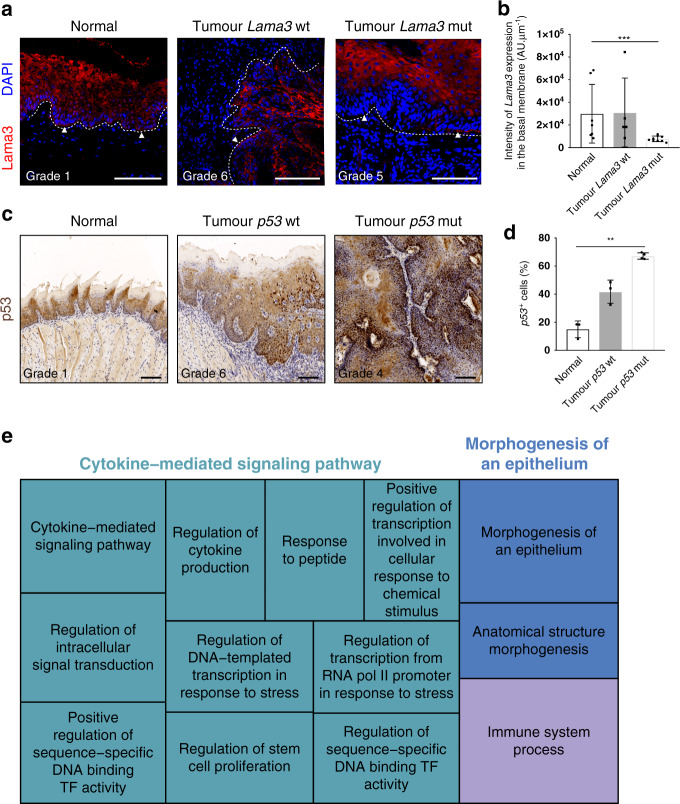
Fig. 3. Expression of Lamininα3 and p53 in mutated tumours.
a, c Representative images of immunostaining of Lamininα3 (a) and p53 (c) in normal tissue, wild-type and mutated tumours. Arrowheads indicate areas with loss of Lamininα3 expression in mutated tumours (n = 6 lesions mutated for Lamininα3). Samples were counterstained with nuclear dye DAPI (4′,6-diamidino-2-phenylindole) (a) or with haematoxylin (c). Dotted line delineates basement membrane. Scale bars, 100 µm. b Quantification of the expression of Lamininα3 in the basement membrane (n = 3 normal samples with n = 7 regions of interest (ROIs) quantified, n = 3 tumour Lama3 wt samples with n = 5 ROIs quantified, n = 4 tumour Lama3 mutated samples with n = 9 ROIs quantified). d Quantification of p53 positive cells (n = 3 normal, 3 tumour p53 wt samples, 4 tumour p53 mutated samples). Bar graphs represent mean ± SD, **p ≤ 0.05, ***p ≤ 0.001, p = 0.0014 for p53, p = 0.0010 for Lamininα3, one-way ANOVA, Kruskal–Wallis test. e Gene Ontology analysis of driver genes. Each rectangle is a single cluster representative of GO categories (biological processes), joined together into three main categories (superclusters): cytokine-mediated signalling pathway, morphogenesis of an epithelium and immune system process. Size of the rectangles is adjusted to reflect the frequency of the GO term in the underlying GO analysis database.

