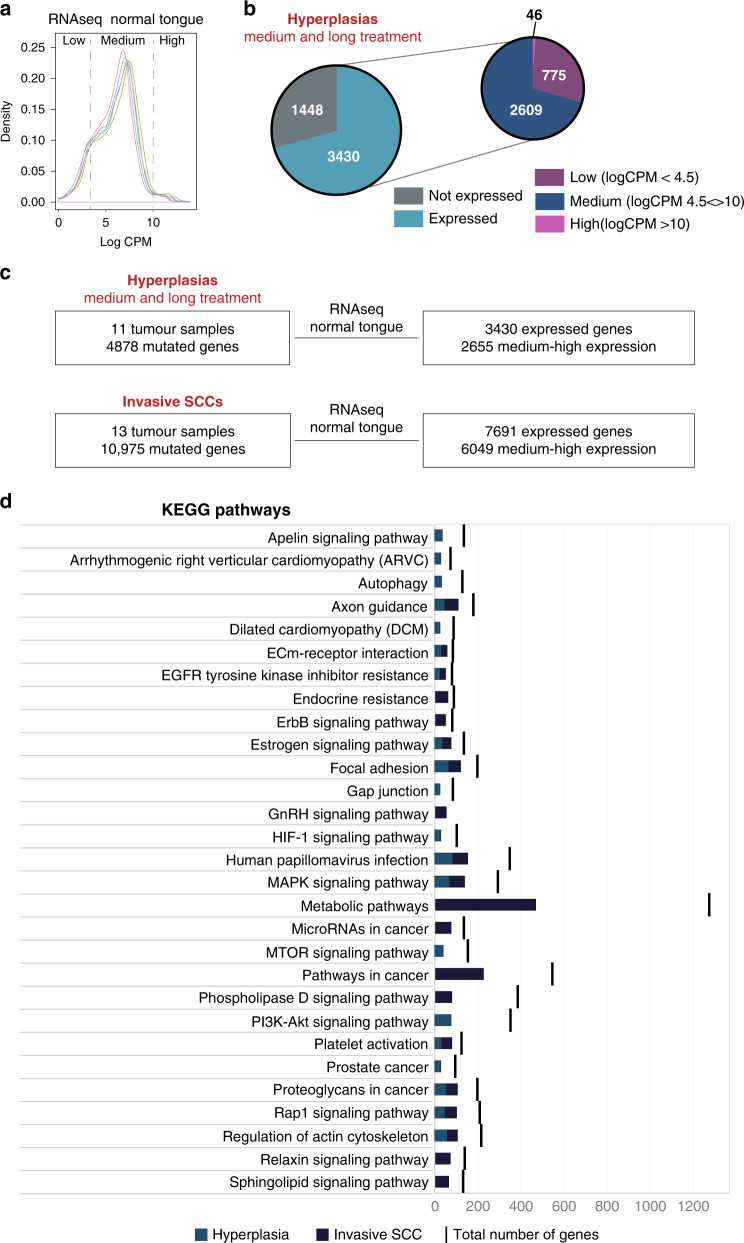
Fig. 4. Functional analysis of the mutations in medium-long treated hyperplasia.
a Expression profile (log CPM – Count Per Million normalised read count) of the 5 datasets of normal tongue samples23. Graph represents the average of CPM values; x-axis is divided in 3 categories: low, medium and high expression genes. b Pie-chart with the number of expressed genes in each category of genes mutated in hyperplastic samples. c Total number of samples and mutated genes in medium and long-treated hyperplasias and in invasive SCC before (left panels) and after (right panels) filtering for the genes medium to highly expressed in the tongue. d Top 10 KEGG pathways enriched in tongue expressed genes mutated in medium and long treated hyperplasias and in invasive SCC. The number of mutated genes in the pathway is indicated as well as the total number of genes in the pathway.

