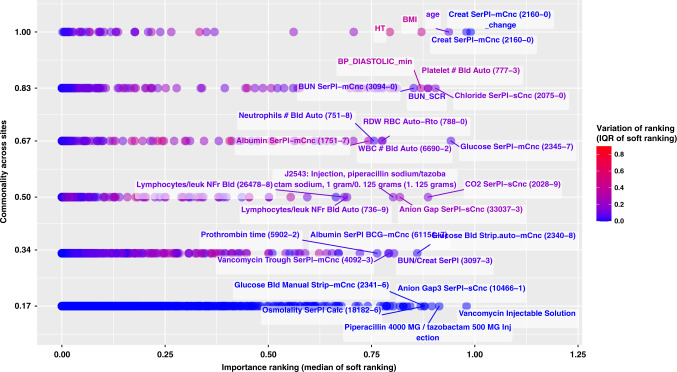
Fig. 4. Feature selection disparities across sites (48-h predictions for at least AKI stage 2).
The figure demonstrates feature importance disparities for the models trained on source data as well as refitted models at each validation site, using all features. Each dot corresponds to one of the most important features ranked among the top-100 by at least one of the six models; y-axis measures the proportions of sites that identified the feature as top-100, or “commonality across sites”; x-axis measures the median of variable importance rankings measured as “soft ranking” (the closer it is to 1, the higher the feature ranks), which is also color coded by the interquartile range (IQR) of the ranks across sites (the higher the IQR is, the more disagreement across sites on the importance of that feature). Top-100 is an arbitrary cutoff we used to analyze the most important features to illustrate heterogeneity. We also reported similar feature disparity figures for models predicting moderate-to-severe AKI prediction without SCr and BUN (Supplementary Fig. 18), as well as models predicting any AKI (Supplementary Figs. 16 and 19).

