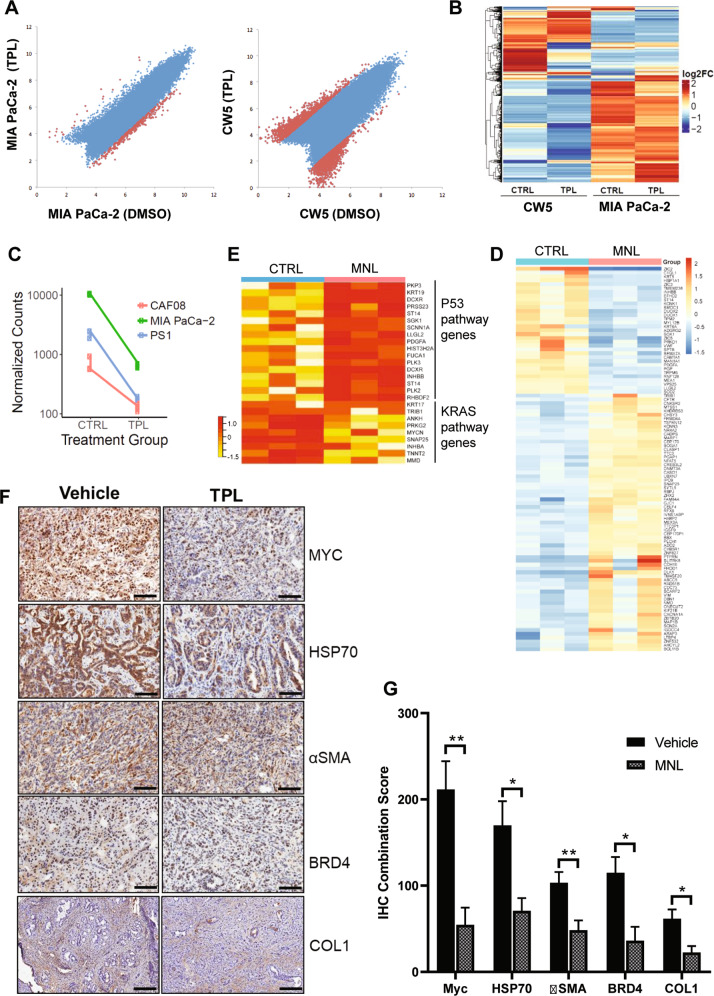
Fig. 3. Triptolide downregulates H3K27ac chromatin marks, overall in vitro gene transcription, and causes deregulation of cancer pathways in animal models.
A Scatter plots of H3K27ac ChIP peak signals are shown for tumor (MIA PaCa-2) and CAF (CW5) cells, showing a substantial downregulation of peaks in triptolide (TPL) treated cells. Notably, CW5 show a larger reduction of peaks compared to tumor cells. B Hierarchical-clustering of differentially expressed genes in CW5 and MIA PaCa-2 cells in response to TPL is shown as a heatmap. The overall reduction in gene expression expressed as log2 fold change is noted in TPL-treated cells compared to DMSO-treated control cells (CTRL). C The effect of TPL in inducing downregulation of gene expression (expressed as normalized counts) as seen in tumor cells (MIA PaCa-2) and fibroblasts (CAF08, PS-1) is shown. D Heatmap of the top 100 differentially expressed genes in pancreatic tumors harvested from the transgenic mouse model of pancreatic cancer (KPC mice) upon Minnelide (MNL) treatment (n = 3 for each treatment group). E Heatmap of gene sets belonging to TP53 and KRAS pathways that are differentially regulated in the Minnelide-treated mouse tumors. F Minnelide reduces the expression of SE-associated genes in mice bearing pancreatic tumors. Representative immunostaining images of SE-associated gene markers (HSP70, MYC, αSMA, BRD4, and COL1) in control and Minnelide-treated samples. Scale bar = 100 µM. G Quantification of immunostaining in F (n = 3). *P < 0.05; **P < 0.01. Error bars represent the standard error of the mean (SEM). TPL Triptolide, MNL Minnelide.

