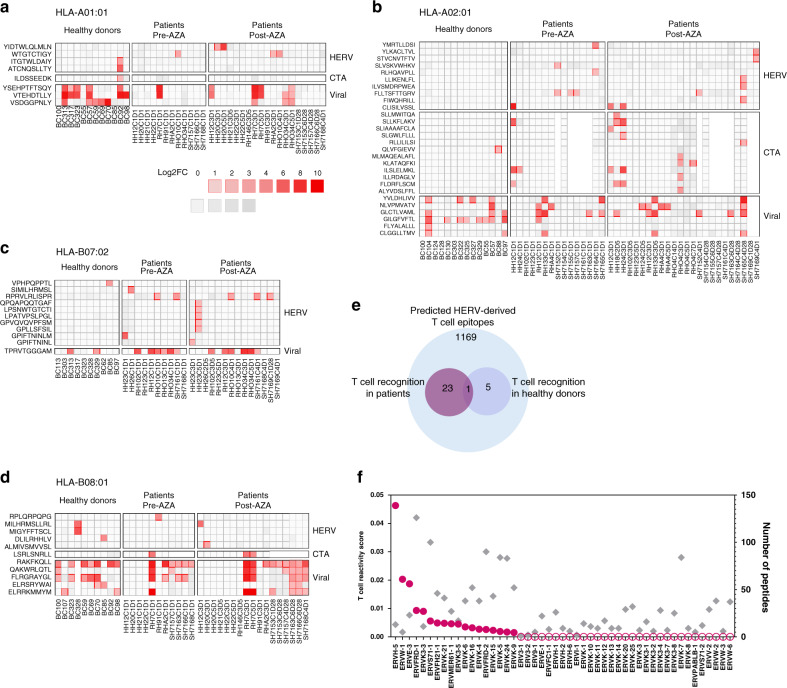
Fig. 2. T cell reactivity to HERV-derived peptides in myeloid malignancies.
T cells reactive to HERV-derived peptides, CTAs, and viral antigens were identified from peripheral blood (Danish patients and healthy donors (HD)) and bone marrow (Australian patients) samples using a DNA barcode-based pMHC multimer analysis. a–d Identified T cell responses are shown across the four tested HLAs for healthy donors and patient samples pre- and post-AZA therapy. Vertical axis labels the sample IDs and the horizontal axis shows the peptide sequences (single letter amino acid codes) split into three categories of antigens (HERV, CTA, and viral). T cell responses are shown based on barcode enrichment (Log2FC) in the sorted population compared to the complete pMHC library, and red scale determines significant enrichment (FDR < 0.1%) and gray scale if no significant enrichment was found. Peptides identified to have a T cell response in at least one of the analyzed samples are included; data for all the tested peptides are shown in Supplementary Fig. 2. The white color indicates peptides not tested in the specific samples. Patient samples with the prefix “RH” and “HH” derive from the Danish patients and patient samples with the prefix “SH” derive from the Australian patients. e Venn diagram summarizing numbers of immunogenic HERV-derived T cell epitopes identified in patients and healthy donors. f T cell reactivity score (pink dots, plotted in descending order) and peptide library size (gray diamonds) of individual HERVs analyzed for T cell recognition in the patients. Pink hollow dots represent HERVs with no T cell reactivity. T cell reactivity score is calculated as the sum of all the T cell reactive peptides out of the total peptide library of a given HERV tested across the patient samples. Source data are provided as Source data file.

