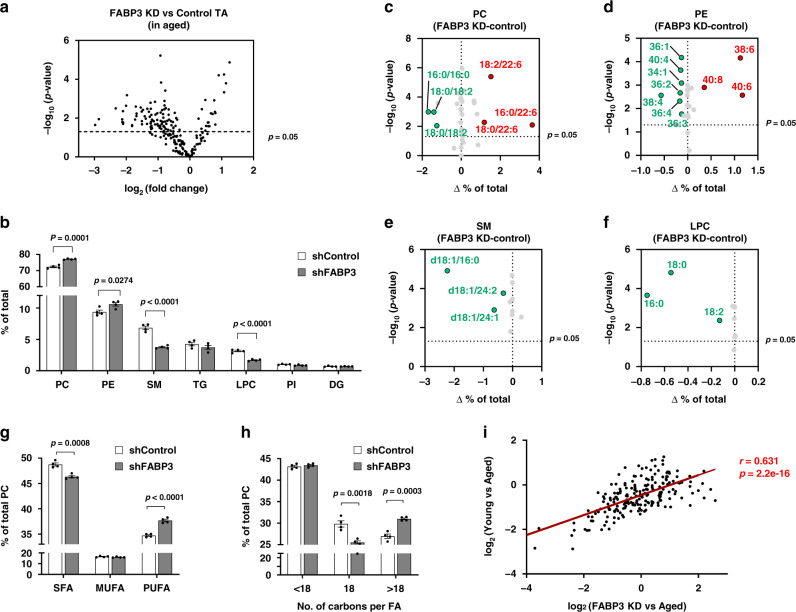
Fig. 5. FABP3 inhibition in aged muscle results in young-like lipid composition.
a Volcano plot of lipid species altered in FABP3-knockdown aged vs. control muscle. Lipid species were measured by LC-MS. The x-axis indicates logarithmic (base 2) fold abundance changes of all identified lipid species and the y-axis indicates negative logarithmic (base 10) t-test p-value. The horizontal dotted line reflects the filtering criterion (p-value = 0.05). (n = 4 mice per group) b Proportion of major lipid classes in FABP3-knockdown and control aged muscles. c–f Volcano plot of PC (c), PE (d), SM (e), LPC (f) species altered in FABP3-knockdown vs. control aged muscles. The x-axis indicates the percentage changes (FABP3KD-control-aged muscle) of lipid species and the y-axis indicates negative logarithmic (base 10) t-test p-values. The horizontal dotted line reflects the filtering criterion (p-value = 0.05). Red and green indicate highly increased and decreased lipid species, respectively. g Proportion of SFA, MUFA, or PUFA PC acyl chains in FABP3-knockdown and control-aged muscles. h Proportion of <C18, C18, or >C18 PC acyl chains in FABP3-knockdown and control-aged muscles. The data are presented as means ± S.E.M. Two-tailed unpaired Student’s t-test was used. i Correlation analysis of the total identified lipid species in the indicated comparative condition. The x-axis indicates logarithmic (base 2) fold concentration changes of all identified lipid species in FABP3-knockdown aged vs. aged muscle and the y-axis indicates logarithmic (base 2) fold changes in aged vs. young muscle. Data in i were analyzed using Spearman’s correlation; correlation coefficient (r) and p-value (p) are in red. Source data are provided as a Source Data file.

