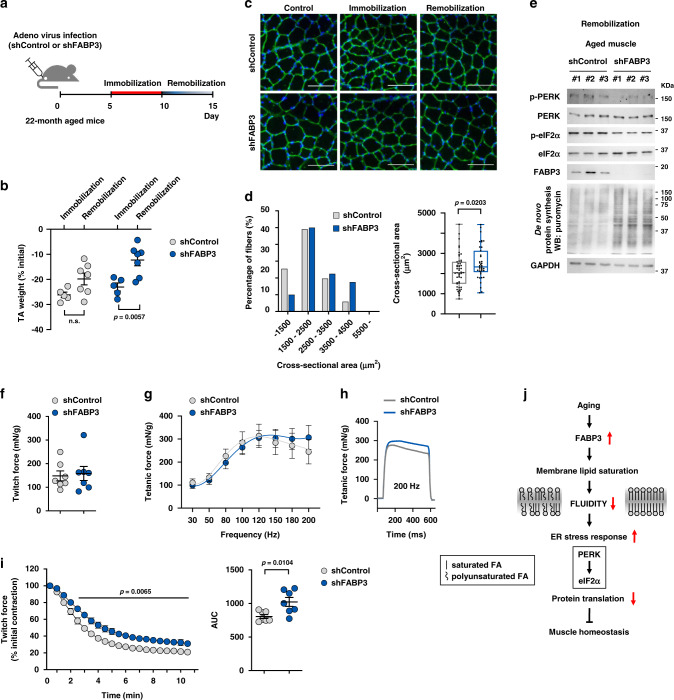
Fig. 8. FABP3 knockdown ameliorated an impaired muscle recovery in aged mice.
a Scheme of the experimental procedures. TA muscles of aged mice were infected with Ad-shFABP3 or Ad-shControl virus, immobilized with a surgical staple 5 days after infection, and allowed to recover (remobilization) after 5-day immobilization. b TA muscle mass was measured at 5 days after immobilization (n = 5) and 5 days after remobilization (n = 7). Changes in muscle weight for immobilization and remobilization were expressed as the percentage of the contralateral non-immobilized muscle weight. c Representative images of laminin (red) and DAPI (blue) staining of myofibers infected with Ad-shFABP3 or Ad-shControl virus Scale bar, 200 μm. d Frequency histograms of the cross-sectional area (left) of Ad-shFABP3 or Ad-shControl virus-infected fibers 5 days after remobilization. Box plot representing the mean fiber cross-sectional areas (right). Box represent the 25th–75th percentiles of the data; whiskers show the min and max range of the data; horizontal lines indicate the median value. e Immunoblot analysis of PERK and eIF2α phosphorylation, and puromycin incorporation in Ad-shFABP3 or Ad-shControl virus-infected TA muscles after remobilization. TA muscles were harvested 30 min post-interperitoneal puromycin injection. (n = 3 mice per group). f–i Ad-shFABP3 or Ad-shControl virus-infected TA muscles were mounted on a force transducer. The maximum twitch force (f) at supra-maximal voltage, 100 V for 1 ms. Frequency dependence of average tetanic force curves (g) at 30–200 Hz, 100 V, 500 ms for each frequency. Tetanic force traces (h) upon stimulation at 200 Hz for 500 ms. Data are presented as means. (n = 7 mice per group) Fatigue index (i) was measured at 1 Hz and 100 V by repeated stimuli for 10 min. Generated force was analyzed as a percentage of the initial contractile force (n = 7 mice per group) (left). Insert represents area under curve (AUC) (right). Data are presented as means ± S.E.M. Two way ANOVA with Bonferroni’s post hoc test was used (left in i) and two-tailed unpaired Student’s t-test was used (b, d, right in i). j Proposed model for age-dependent lipid remodeling by FABP3. Source data are provided as a Source Data file.

