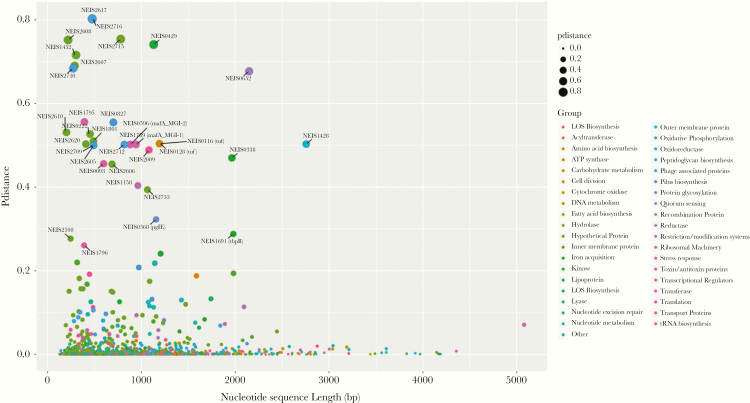
Figure 1.
Core loci diversity. Diversity of core genome loci plotted against nucleotide sequence length (base pairs [bp]). Loci are color coded by functional group; for example, olive green circles represent hypothetical protein genes. Circle size is proportional to the amount of diversity. It can be seen that much of the core genome is highly conserved including loci >4000 bp in length.

