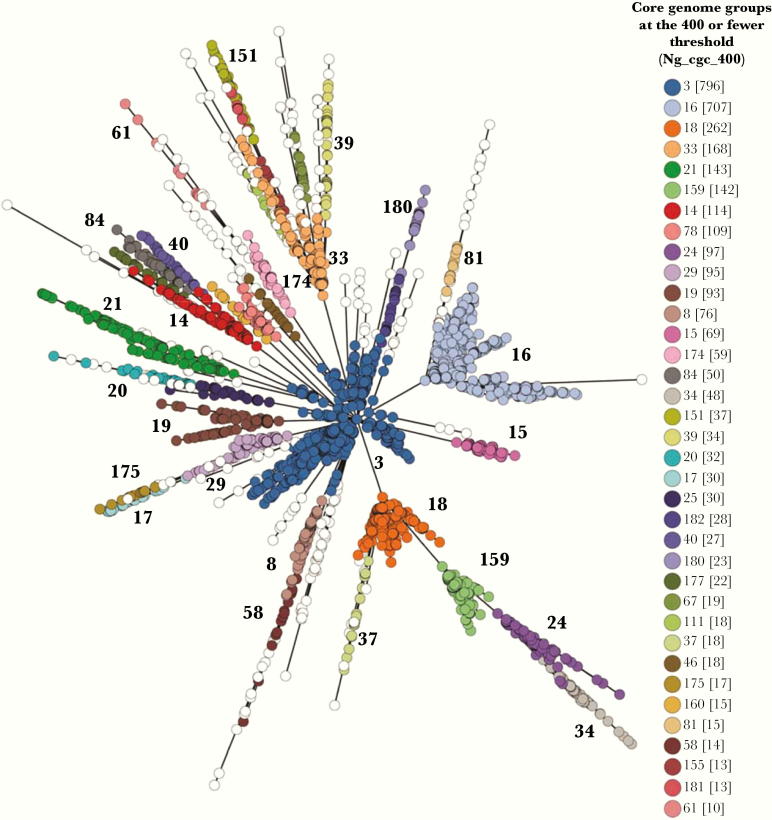
Figure 2.
Minimum spanning tree comparing core genome allelic profiles in association with Ng_cgc_400 core genome groups. Whole genome sequence data were compared using GrapeTree resulting in isolates with similar allelic profiles forming clusters. These were then annotated by core genome group following the 400 or fewer locus threshold. Core genome groups with less than 10 isolates are represented with white circles. Numbers in brackets refer to the number of isolates belonging to that core genome group. Ng_cgc_400 core genome groups are also displayed next to each cluster.

