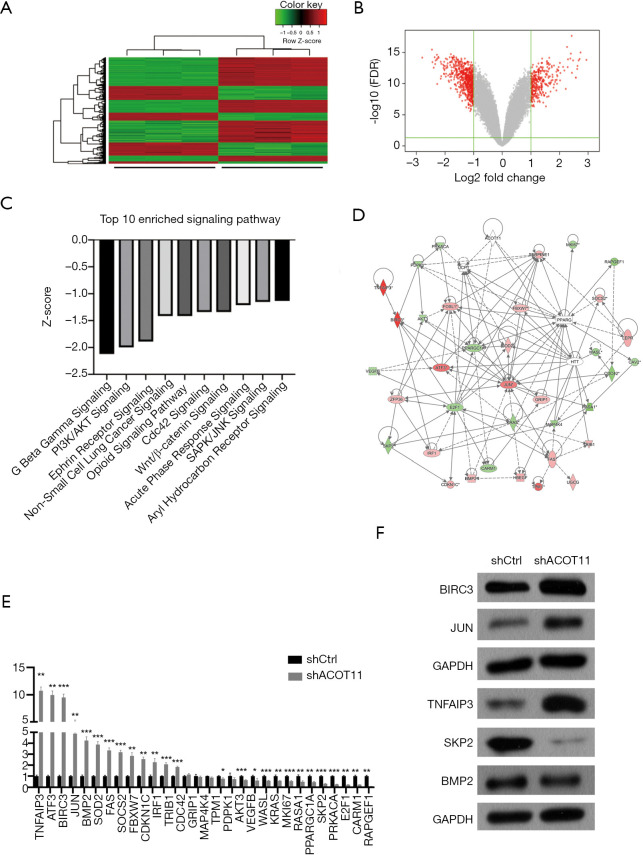
Figure 6.
Gene expression profiling identifies transcriptional targets downstream of ACOT11. (A,B) Transcriptome profiling through microarray assay identified differentially expressed genes (DEGs) in A549 cells transduced with ACOT11 RNAi lentivirus or blank lentivirus. DEGs was shown in a hierarchical clustering plot (A) and a volcano plot (B). Genes with absolute fold change >2.0 and FDR <0.05 were defined as DEGs. (C) Ingenuity Pathway Analysis (QIAGEN, USA) was conducted to determine the enriched signaling pathways with all DEGs. The Top 10 enriched Pathways with Z-score <0 was listed. Pathways with Z-score <0 was considered to be inhibited due to the integrative negative regulating effect performed by the DEGs involved. (D,E,F) Gene interaction network analysis (D) was performed using DEGs manually selected from the top 10 enriched pathways, and mRNA expression of the DEGs were confirmed by qPCR (E), among which BIRC3, JUN, TNFAIP3, SKP2, BMP2 protein expression (F) were further measure through Western blot. *P<0.05; **P<0.01; ***P<0.001.

