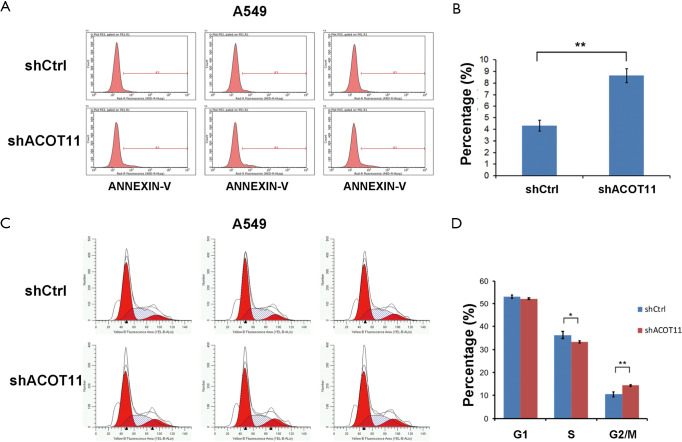
Figure S1.
ACOT11 knock down induced apoptosis and cell cycle dysregulation in A549 cells. (A,B) Annexin-V-APC labelling and flow cytometry was conducted to measure cell apoptosis in A549 after ACOT11 was knock down. percentage of cells in apoptosis was quantified. (C,D) PI staining and flow cytometry was performed to evaluate cell cycle in A549 after ACOT11 was knock down. Cell numbers in indicated cell cycle phase was quantified. Data are presented as mean ± SD. Student’s t-test was conducted to *P<0.05; **P<0.01.

