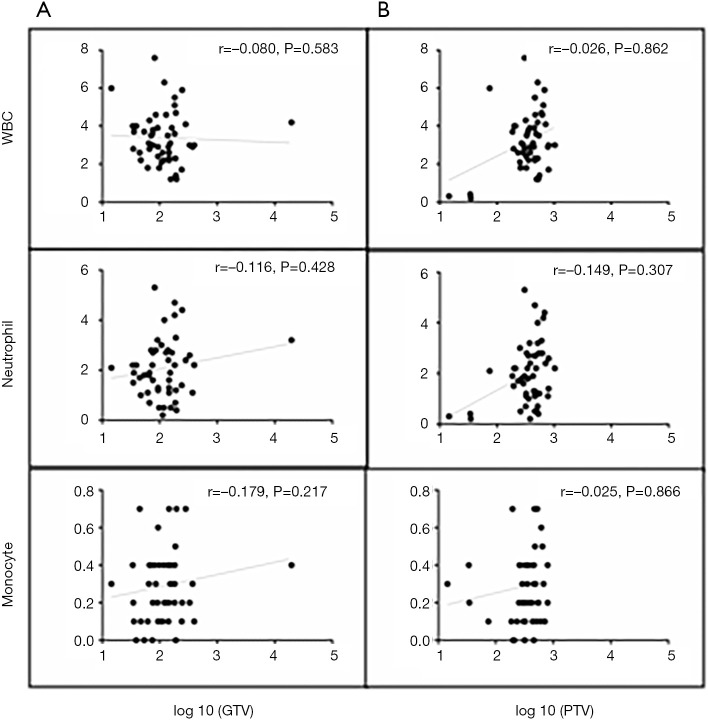
Figure S1.
Correlations among nadirs of WBC, neutrophils, and monocytes during radiotherapy and log 10 [GTV (cc)] and log 10 [PTV-g (cc)]. Spearman’s correlation coefficients and corresponding P values are shown. WBC, white blood cell; GTV, gross tumor volume; PTV-g, planning target volume without CTV expansion, r, correlation coefficient.

