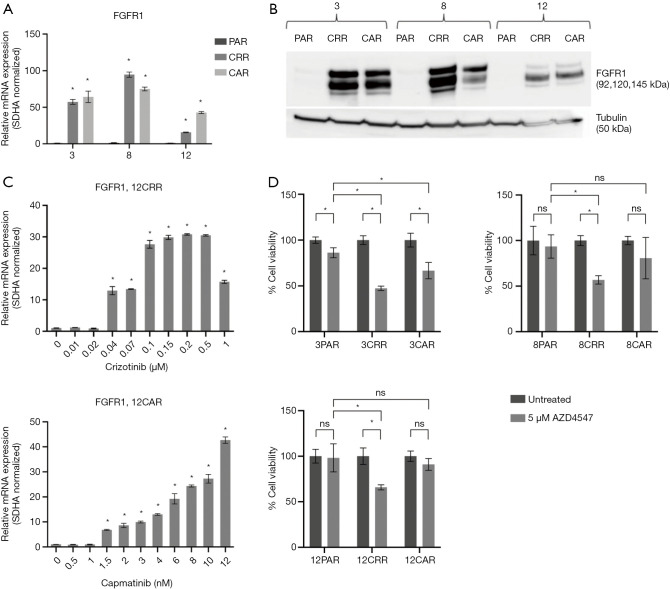
Figure 3.
FGFR1 expression and AZD4547 sensitivity. (A) Expression of FGFR1 mRNA in parental and resistant cells. Values are normalized to SDHA and subsequently to the expression in the parental cell line. Significance between the resistant cells compared to the parental cells is calculated and denoted by an asterisk (*P≤0.05). (B) Western blot analysis of FGFR1. Tubulin was used as loading control. (C) Expression of FGFR1 in 12CRR and 12CAR during development of resistance. Values are normalized to SDHA and subsequently to the expression in 12PAR. Significance between the resistant cells from each concentration step compared to the parental cells is calculated and denoted by an asterisk (*P≤0.05). (D) MTS analysis of cell viability for parental and resistant cells treated with 5 µM AZD4547, an FGFR inhibitor. All values are normalized to the value of the untreated sample of each individual cell line (*P≤0.05, ns: not significant).

