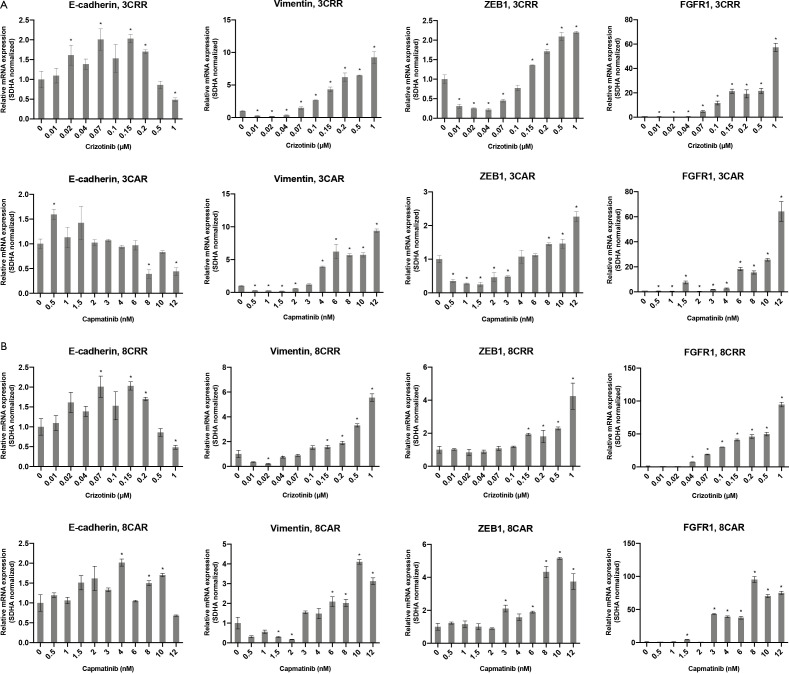
Figure S4.
Expression profile of EMT markers and FGFR1 in 3CAR and 3CRR (A) and 8CAR and 8CRR (B) during development of resistance. Values are normalized to SDHA and subsequently to the corresponding parental cell line. Significance between the resistant cells from each concentration step compared to the parental cells is calculated and denoted by an asterisk (*P≤0.05).

