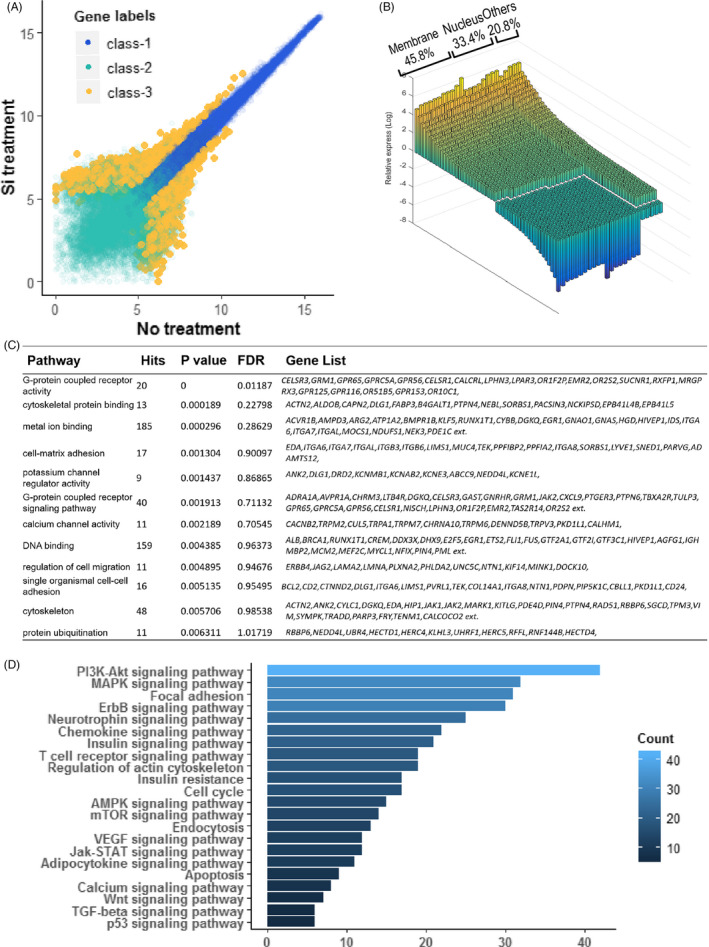
FIGURE 6.

Results obtained from Affymetrix gene expression chip and PEX100 protein activation chip analysis on the HBMSCs cultured with or without Si. A, The scatter plot of gene expression (X axis for Si 1/128 treatment, Y axis for NC). Differentially expressed genes were shown as class‐3. B, Cellular component distributions of differentially expressed genes according to Gene Ontology. 45.8% of these genes were membrane localized and 33.4% were nucleus localized. Other component were 20.8% only. C, KEGG cluster analysis according to gene expression data. D, KEGG cluster analysis according to protein activations chip. These cluster data showed that numerous base signal pathways were activated, including G protein signal pathways, cytokine pathways, ion channels, PI3K‐IP3 pathways. HBMSC, human bone marrow mesenchyme stem cell; NC, negative control
