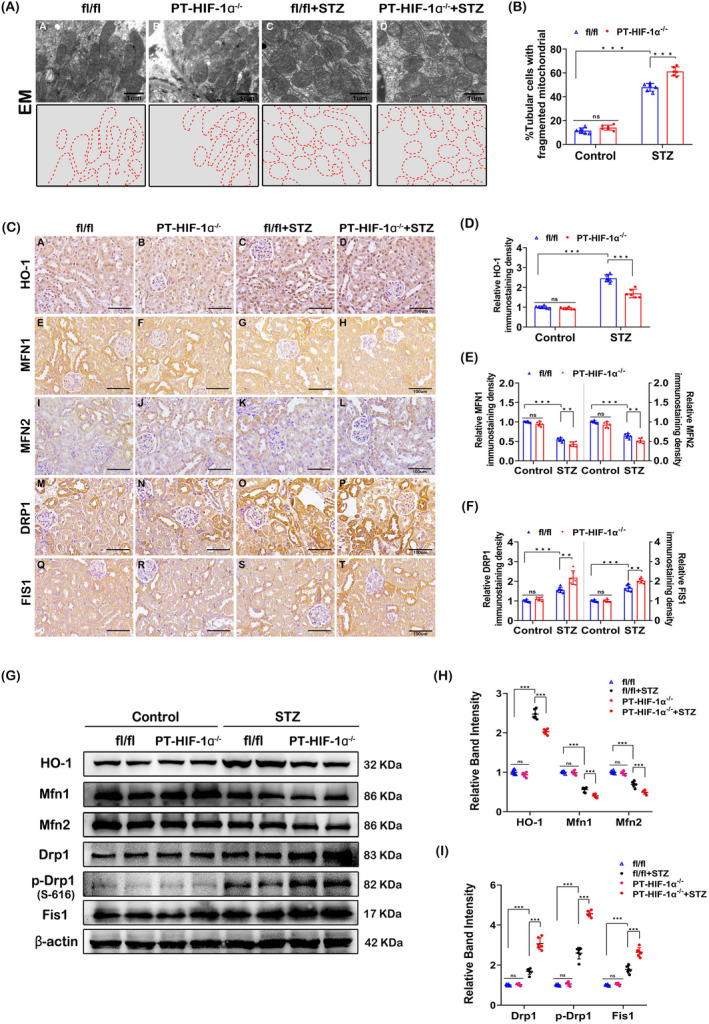
Figure 2.

Alterations in mitochondrial dynamics in diabetic PT‐ HIF‐1α−/− mice. A, EM micrographs showing fragmented mitochondria in renal tubules (upper). The aforementioned EM micrographs of mitochondria were traced (below). B, Histogram showing the percentage of fragmented mitochondria. C, IHC staining of kidney tissue revealed the expression of HO‐1, Mfn1, Mfn2, Drp1 and Fis1. D‐F, Semiquantification of the protein levels from the IHC shown staining in C. G‐I, Representative Western blot bands (G) and relative band densities (H and I) indicating HO‐1, Mfn1, Mfn2, Drp1, p‐Drp1(S‐616) and Fis1 expression. ***P < .001; **P < .005; *P < .05. n = 6
