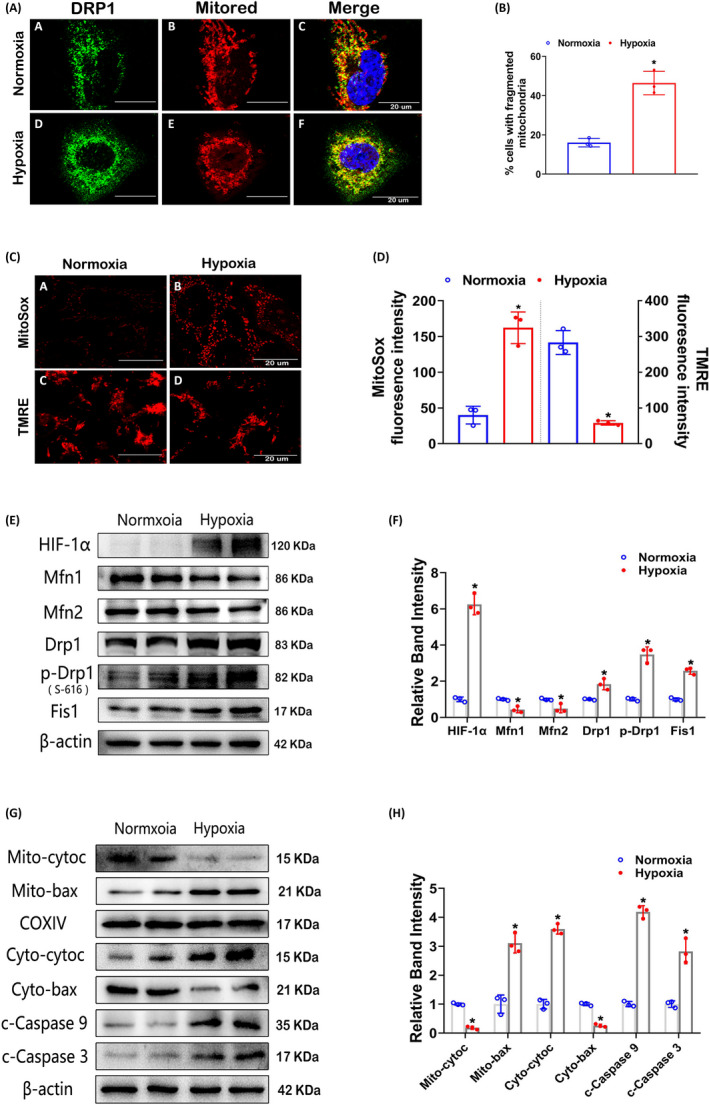
Figure 3.

Mitochondrial morphological changes, apoptosis and related protein expression in HK‐2 cells in hypoxia. A, In HK‐2 cells treated with or without CoCl2, IF staining was performed with an anti‐Drp1 antibody and MitoTracker Red. The yellow dots represent the colocalization of Drp1 and mitochondria. B, Quantitative analysis of mitochondrial fragmentation was performed. C, Confocal images of MitoSox Red and TMRE staining indicating mitochondrial ROS generation and the mitochondrial membrane potential (△Ψm), respectively. D, Quantitative analyses of MitoSox Red and TMRE staining. E, Western blot analysis of HIF‐1α, Mfn1, Mfn2, Drp1, p‐Drp1(S‐616) and Fis1 expression in HK‐2 cells in normoxia or hypoxia. (F) Bar graph showing the quantitative analysis results of the relative band densities. G and H, Representative Western blot bands (G) and quantitative analysis (H) of mito‐Cyt.C, mito‐Bax, cyto‐Cyt.C, cyto‐Bax, c‐caspase‐9 and c‐caspase‐3. *P < .05 vs the normoxia group. n = 3
