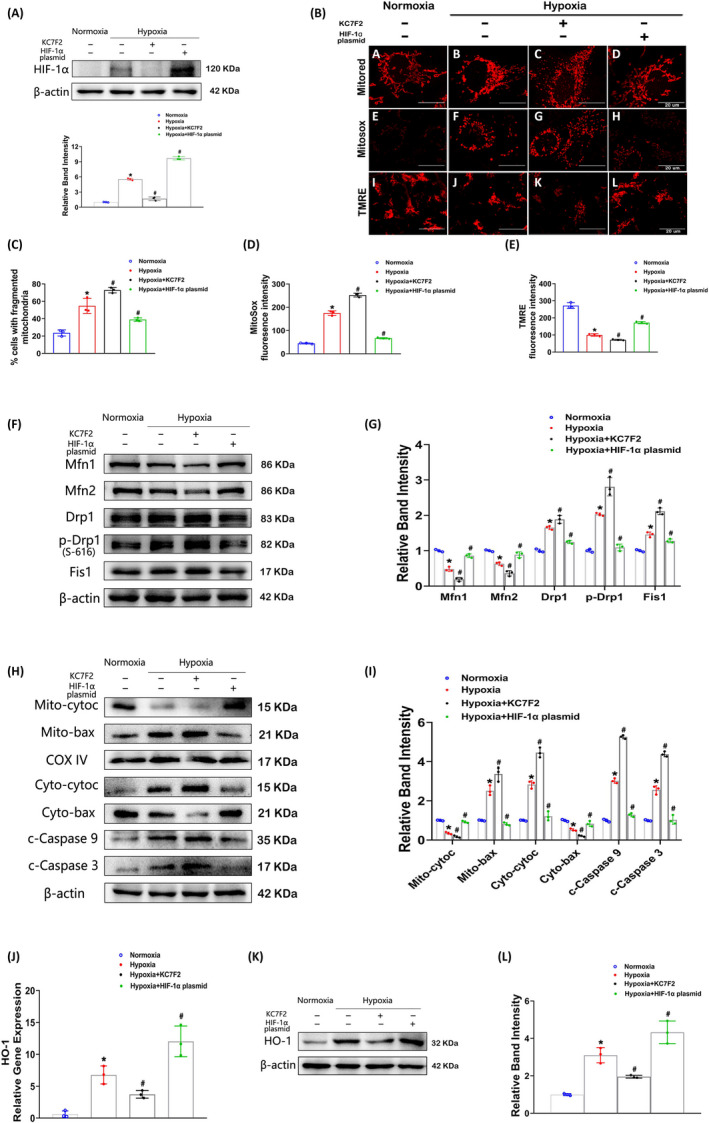
Figure 4.

Effects of HIF‐1α on hypoxia‐induced mitochondrial damage in HK‐2 cells. A, Representative Western blot bands indicating HIF‐1α expression in HK‐2 cells treated with KC7F2 (a HIF‐1α inhibitor) or transfected with a HIF‐1α plasmid in hypoxia. B, Representative mitochondrial morphology, ROS generation and mitochondrial membrane potential as detected by MitoTracker Red (upper), MitoSox Red (middle) and TMRE (below) staining, respectively. C‐E, Histograms depicting mitochondrial fragmentation (C), the ROS production (D) and mitochondrial membrane potential (E). F and G, Representative Western blot bands (F) and relative densities (G) of Mfn1, Mfn2, Drp1, p‐Drp1(S‐616) and Fis1 expression in HK‐2 cells treated as described in A. H and I, Expression of mito‐Cyto.C, mito‐Bax, cyto‐Cyto.C, cyto‐Bax, c‐caspase‐9 and c‐caspase‐3 was revealed by Western blotting(H) and related densitometric analysis (I). J, The HO‐1 mRNA levels in HK‐2 cells were measured by real‐time PCR analysis. K and L, The protein expression of HO‐1 was assessed by Western blotting (K) and quantitative analysis (L). *P < .05 vs the normoxia group; # P < .05 vs the hypoxia group. n = 3
