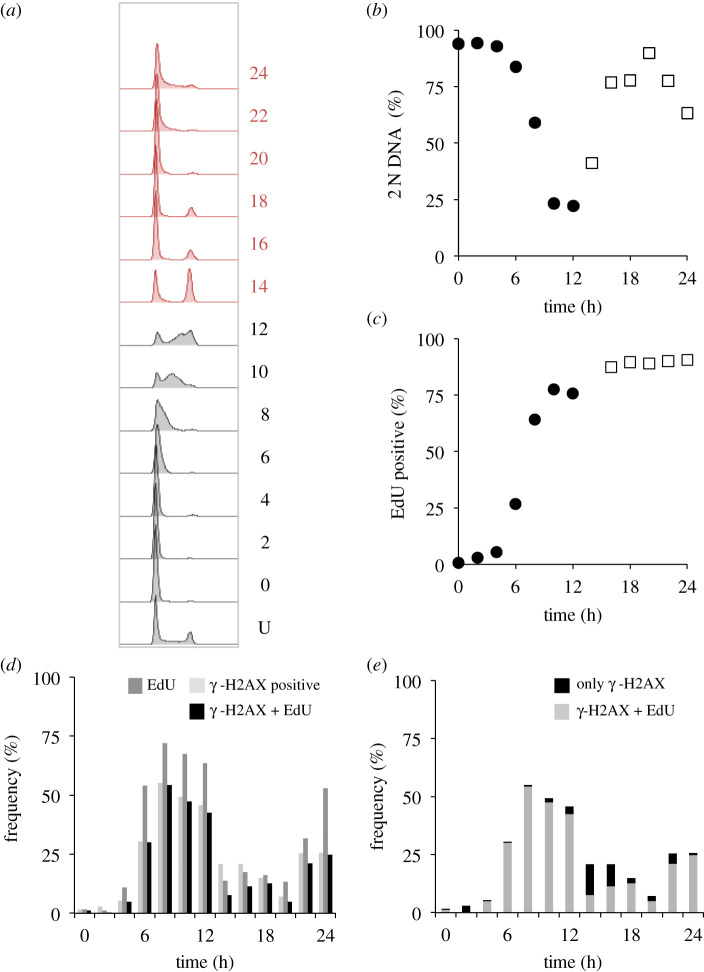
Figure 9.
γ-H2AX foci associated with DNA replication in hTERT-RPE1 cells. hTERT-RPE1 cells were grown to around 1.5 × 10⁴ cells cm−2 in DMEM (+10% serum), trypsinized and plated at 4.4 × 103 cm−2 in 10 cm dishes. Three 10 cm dishes were plated for each timepoint, one for propidium iodide staining (a,b), one for cumulatative EdU incorporation and one with coverslips for immunofluorescence. Twelve hours later, 150 nM palbociclib was added. Twenty-four hours later, cells were washed twice before incubation in pre-warmed medium that did not contain any palbociclib. At this point, one-third of dishes were left without EdU addition, 1 µM EdU was added to one-third of dishes at the time of release from palbociclib arrest, to monitor the cumulative accumulation of this marker of DNA replication (i.e. the extent of S phase progression at any one given point). In the dishes containing coverslips, 10 µM EdU was added to each dish just 1 h before these samples were fixed, in order to identify cells that were highly likely to have been actively replicating at the time of fixation. The cells with no EdU treatment were stained with propidium iodide, to monitor DNA content (a) that was used to calculate the value for the proportion of the population with 2 N DNA content (b), alongside the proportion of the population that had incorporated the EdU at any one time point (c). The samples from the population that had been subjected to the 1 h 10 µM EdU pulses were counterstained with γ-H2AX antibodies (d, e). The numbers next to the plots in (a) indicate hours since release, with U indicating an untreated control population. (d) Plots show the frequency of cells with staining of more than two γ-H2AX foci (light fill), EdU (intermediate fill) or those cells positive for both markers (black). (e) Focuses on the γ-H2AX-positive cells. The plots show the following at the indicated time points after palbociclib removal: the proportion of the whole population that stain positive for γ-H2AX alone (black, i.e. damaged cells, unlikely to be in S phase at the time of fixation), or for both γ-H2AX and EdU (grey, cells in S phase at the time of fixation). For each time point, at least 200 cells were counted to score each characteristic as a proportion of the total counted. The two populations sampled in parallel after staggered palbociclib addition are differentiated by grey and red in (a), closed circles and open squares in (b,c). This experiment was repeated three times with the similar outcomes each time; however, the finer kinetics of the synchrony plots differed and so it was not appropriate to combine the datasets.

