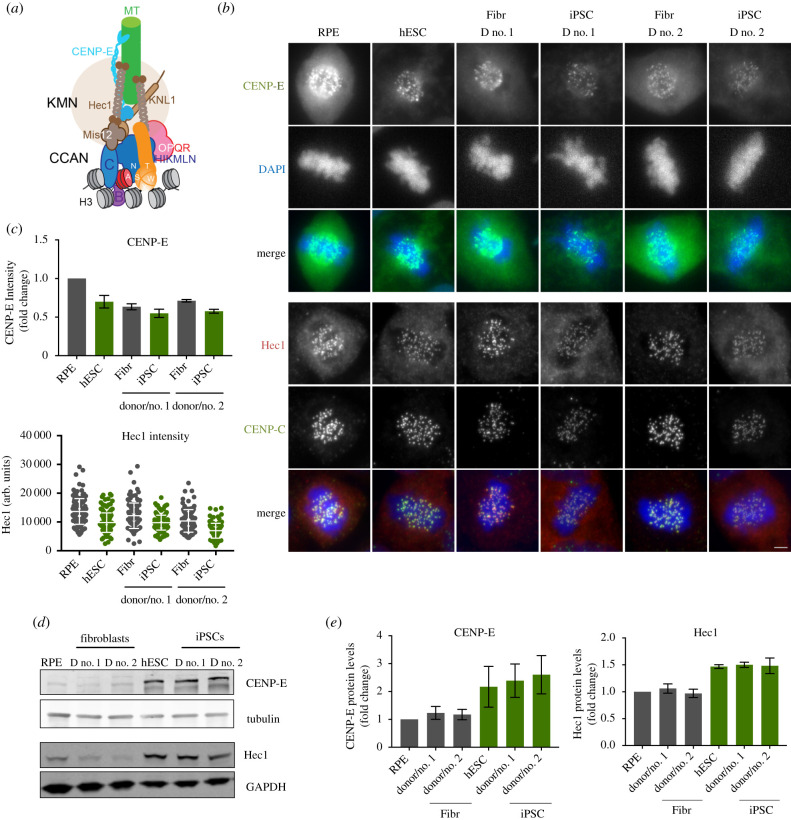
Figure 4.
Reduced outer kinetochore size of PSCs in mitosis. (a) Scheme representing the architecture and interactions of different proteins that comprise the human centromere and kinetochore. (b) Representative immunofluorescence images from differentiated (RPE and fibroblasts derived from donor no. 1 and donor no. 2–Fibr D no. 1 and Fibr D no. 2) and pluripotent stem cells (human embryonic stem cell line H9–hESC and iPSCs reprogrammed from Fibr D no. 1 and Fibr D no. 2–iPSC D no. 1 and iPSC D no. 2) for CENP-E and Hec1. (c) Quantitation of centromeric CENP-E and Hec1. Mean levels of fluorescence per nuclei was measured (CENP-E) or average centromere intensities were determined using automatic centromere recognition and quantification (Hec1). The average and standard error of the mean of one (Hec1) or three (CENP-E) independent experiments are shown. (d) Human ESCs, RPE, iPSCs and the fibroblasts they were reprogrammed from, were harvested and processed for SDS-PAGE and immunobloting. CENP-E and Hec1 levels were assessed with specific antibodies. GAPDH (Hec1) or tubulin (CENP-E) was used as a loading control. CENP-E and CENP-A (in figure 2) were detected in the same gel shown using different channels. (e) Quantitation of WB bands. Average and standard error of the mean of three independent experiments are shown. Protein levels were normalized to GAPDH or tubulin. Scale bar = 2 µm.

