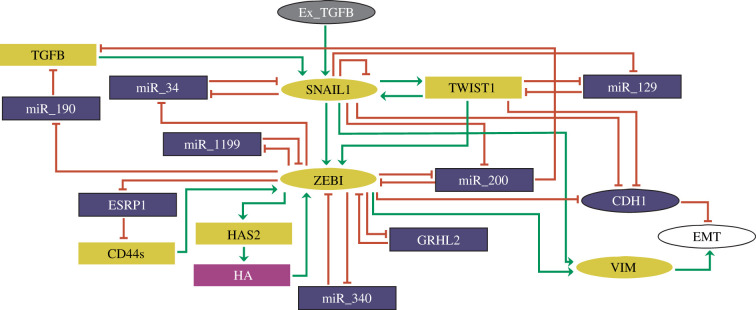
Figure 1.
Proposed regulatory network of TGF-β-driven EMT. Elliptic and rectangular nodes represent multi-valued and Boolean components, respectively. Nodes in grey and white denote the input (Ex_TGFB) and the output (EMT) of the network, respectively. Epithelial markers in the network are represented by blue, while mesenchymal markers are in yellow. Green arrows represent activatory interactions and hammer-head arcs denote inhibitory ones. The rectangular node in purple represents hyaluronic acid (HA). This figure was generated using GINsim 3.0.0b.

