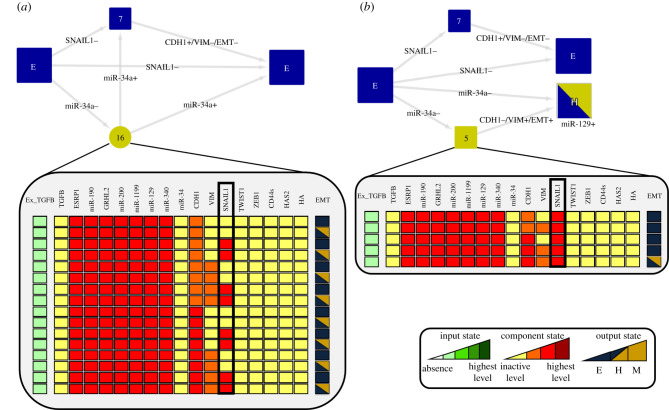
Figure 3.
Analysis of lower input active level. In HTG, most-left states represent initial states of the simulation, whereas most-right ones denote final states. Arrows representing transitions between the states are labelled with the updated components. Plus and minus signs indicate that the component is increasing or decreasing its activity level, respectively. Blue and yellow transient states denote that incoming transitions are related to E and M phenotypes, respectively. The number of states that compose each transient is shown. (a) We observed that the unperturbed SNAIL1 circuit generated trajectories where the final state was only the E state. The HTG shows that SNAIL1 transient oscillations can also contribute to stabilize the E state. The depicted 16 states show that the system can oscillate between E and H states until it finally remains at the E state. (b) LoF of SNAIL1 self-inhibition triggers the transition to the H state destabilizing the E state.

