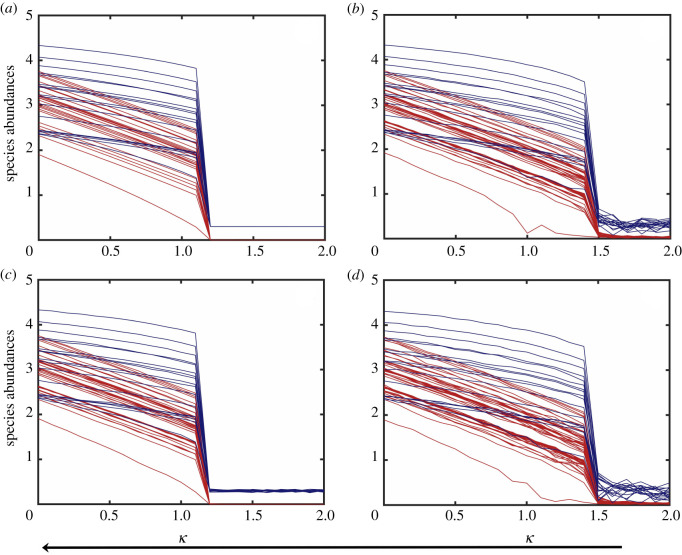
Figure 2.
Noise-induced recovery process. (a–d) Species abundances versus the bifurcation parameter as its value continuously decreases from that in the extinction state for the four cases of absence of noise, EN, DN and EDN, respectively. The red and blue curves represent the pollinator and plant abundances, respectively. The recovery points for the four cases are approximately 1.2, 1.5, 1.2 and 1.5, respectively. Other parameter values are , , γ = 1, h = 0.2, ρ = 0.5, μX = 10−4 and μY = 10−4. In (b,d), the environmental noise amplitude is σ = 0.1. In (c,d), the demographic noise amplitude is ζ = 0.025. The time duration of each simulation run is T = 400, which is sufficient for the transition from a low to a high abundance state to complete. The initial conditions are randomly chosen from the basin of the low abundance steady state.

