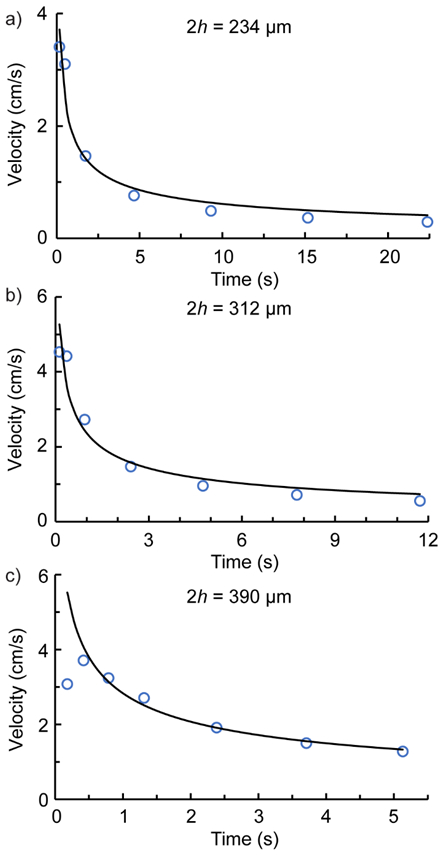
Figure 6.

The liquid front velocity as a function of time in horizontal operation. The circle symbols ( ) correspond to the experimental values while the black line represents the model predictionl. The gap heights are (a) 234 μm, (b) 312 μm, and (c) 390 μm.
